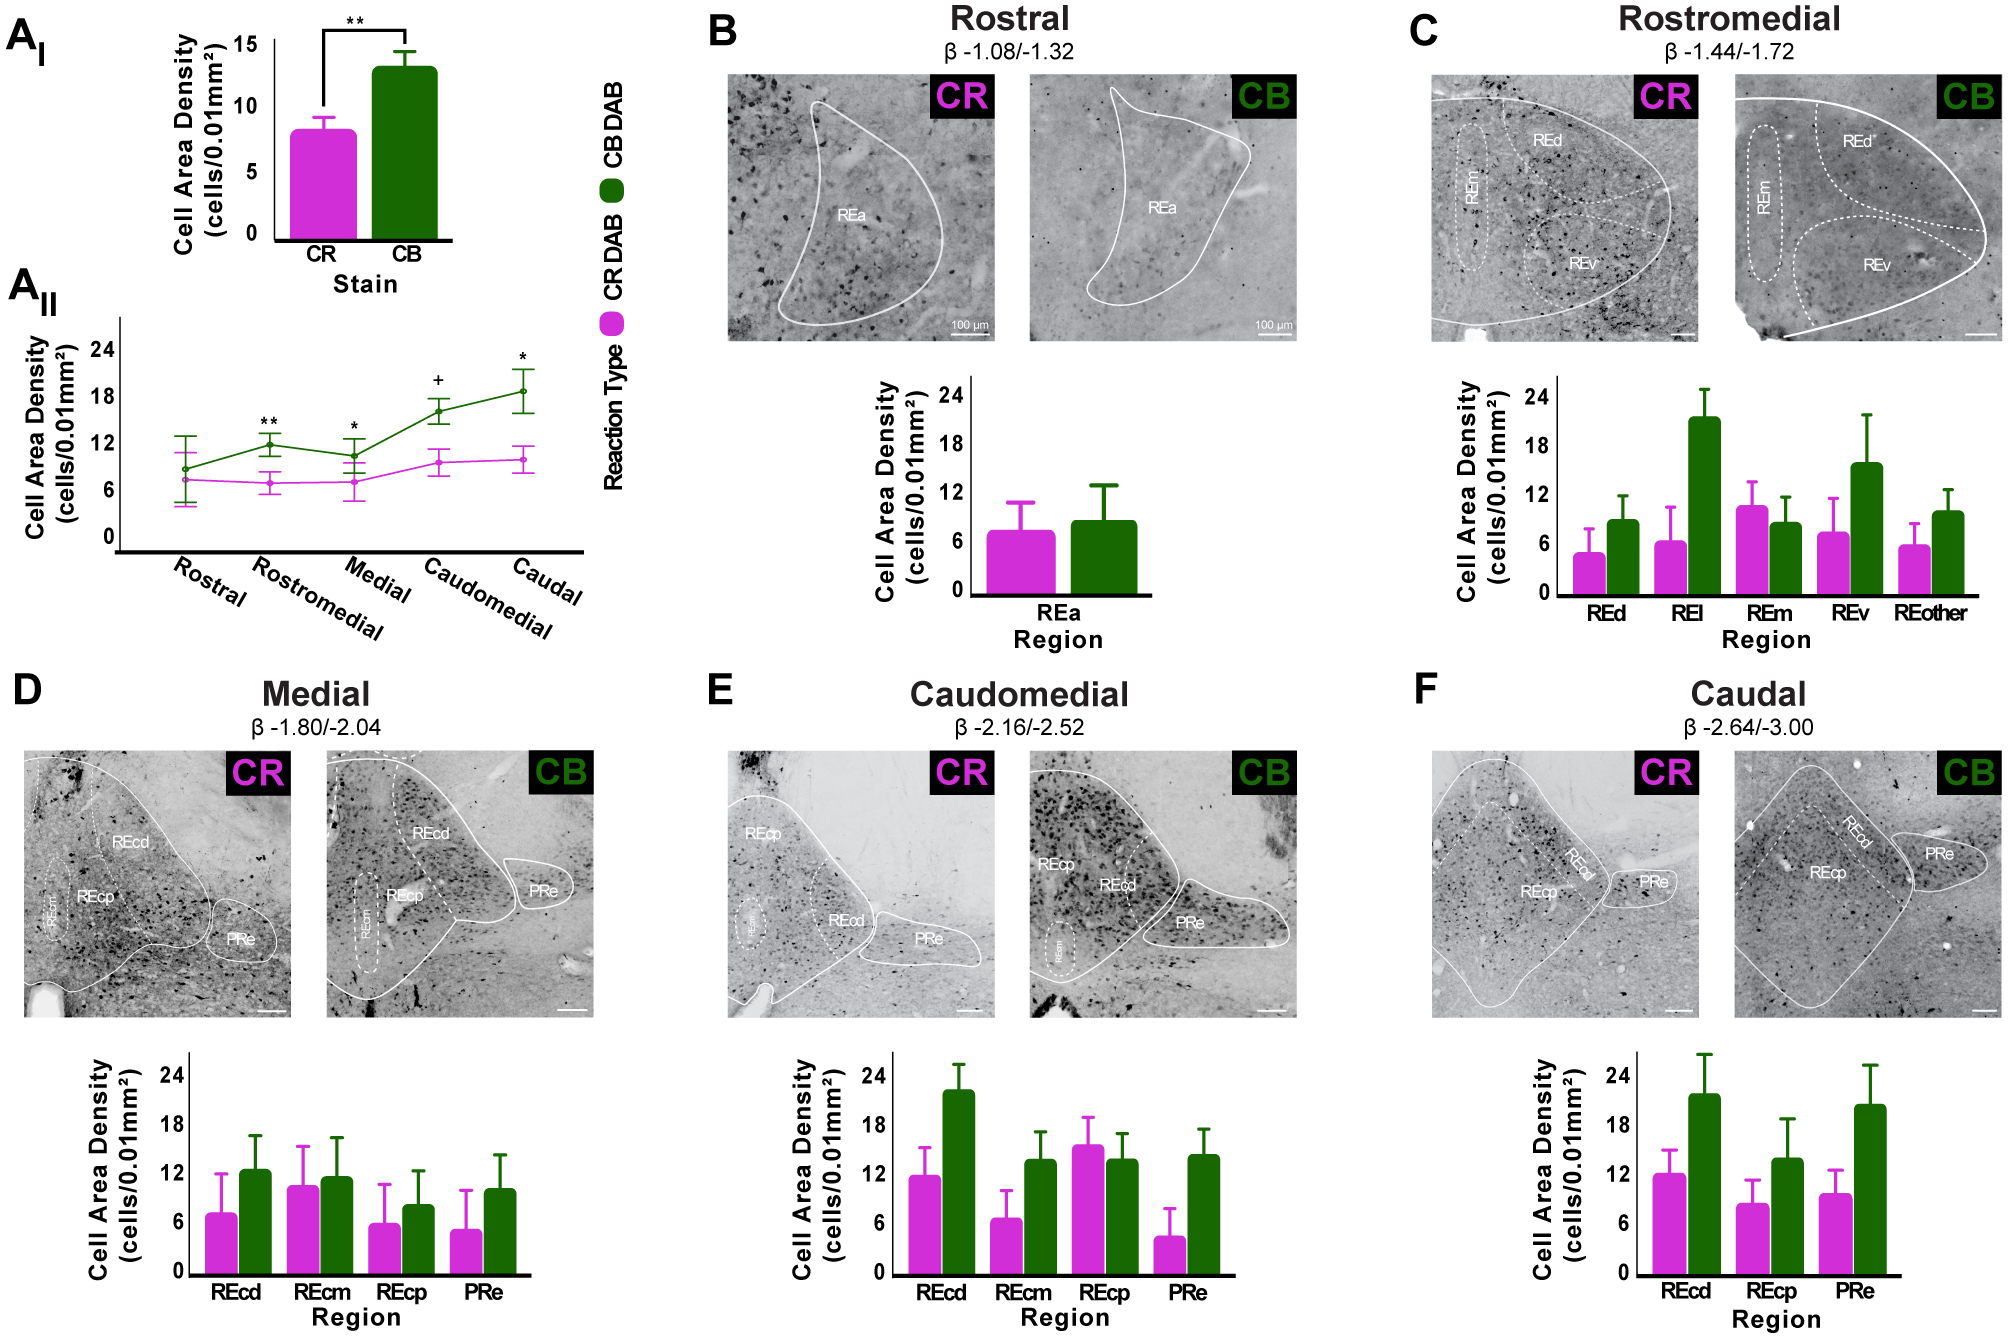
Figure 5. RE is mainly a CB+ containing structure but CR+ and CB+ cell area densities vary across its internal subdivisions.

A: In RE, CB+ cell area density is significantly higher than CR+ cells (Ai). RE CB+ cell area density is higher than CR+ cells across all rostro-caudal levels examined (Aii) and this relationship is significantly different at most levels. Additionally, there is an upward trend in CB+ cell area density toward caudal levels, while CR+ cell area density remains stable throughout RE. Asterisks indicate significance: *p < .05; **p < .01; +, trend towards significance.
B-F: Brightfield images (top) and bar graphs (bottom) showing the distribution of DAB CB+ and CR+ cells throughout RE’s internal subdivisions as defined in Swanson (2018) atlas. Rostral RE, exhibits similar levels of CB+ and CR+ cell area density (B). In rostromedial (C) and caudomedial (E) levels, CB+ cell area density is higher than CR+ cell area density except in REm and REcp, respectively. RE medial (D) and caudal (F) levels exhibit higher CB+ cell area density than CR+ across all RE subdivisions. No significant differences between CB+ and CR+ expression were found in any of RE internal subdivisions (all p > .05). Scale bar = 100μm.
Abbreviations: β, bregma; CB, calbindin; CR, calretinin; DAB, 3,3’-Diaminobenzidine; PRe, perireuniens, RE, nucleus reuniens of the thalamus, REa, reuniens rostral division anterior part; REd, reuniens rostral division dorsal part; REl, reuniens rostral division lateral part; REm, reuniens rostral division median part; REv, reuniens rostral division ventral part; REcm, reuniens caudal division median part; REcd, reuniens caudal division dorsal part; REcp, reuniens caudal division posterior part.
