Figure 7.

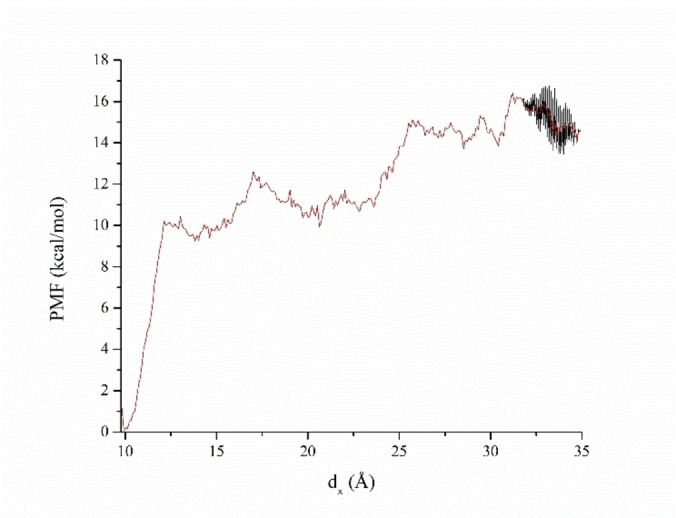
PMF during the metadynamics simulation of the Plpro‐metergoline complex. The Red line represents averaged multiple PMF curves in the range from 4.11 and 4.16 ns of the metadynamics simulation.

PMF during the metadynamics simulation of the Plpro‐metergoline complex. The Red line represents averaged multiple PMF curves in the range from 4.11 and 4.16 ns of the metadynamics simulation.