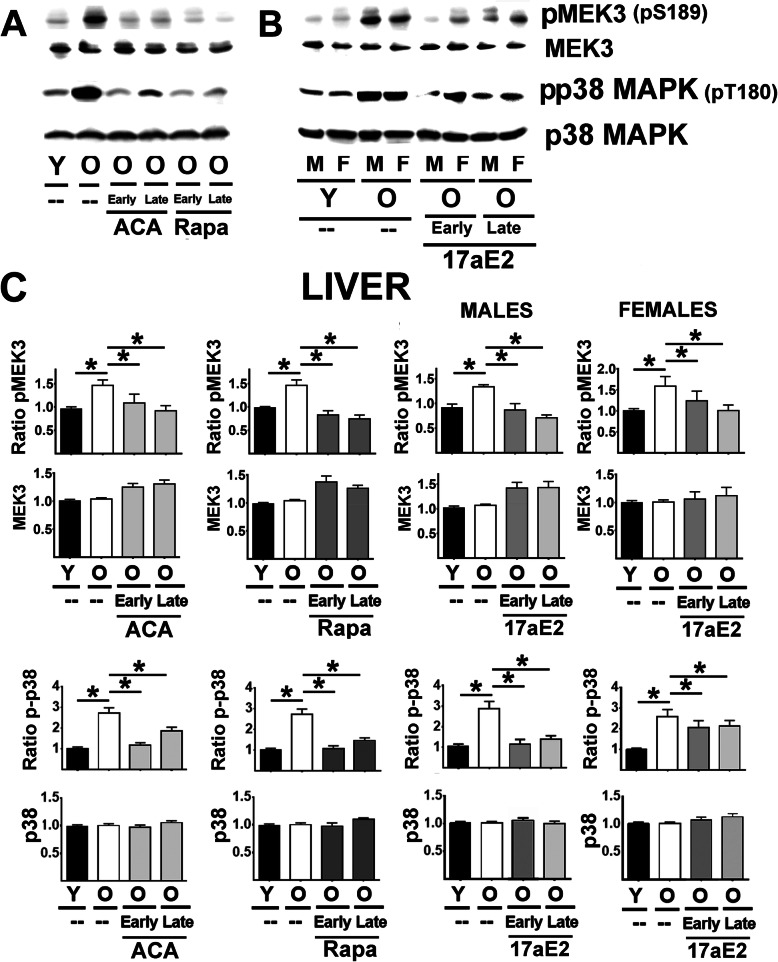
Fig. 6.
Effect of ACA, Rapa and 17aE2 treatments on liver MEK3 and p38MAPK signaling in liver. A Representative western blots for phospho-MEK3 at Ser189 (pMEK3) and total levels of MEK3 protein as well as phosphor-p38MAPK at Threonine 180 (p-p38) and p38 protein levels in liver samples from young untreated (Y), old untreated (O), old treated with ACA or Rapa (O, early and late treatments). B Representative western blots of 17aE2 (early and late) effects on pMEK3, MEK3, p-p38 and p38 protein levels separated by sex (males = M, females = F). C Bar graphs represent the mean ± SEM of pMEK3 ratios and MEK3 protein levels in liver samples from 16 young and 16 old mice plus, at least, 8 mice for each of the ACA and Rapa treatments groups. The 17aE2 was from 8 young males and 8 young females, 8 old males and 8 old female mice, while treatments represent a minimum of 4 mice for each treatment and sex group. All values have been normalized to young control females as described in the Methods section. The (*) indicates statistical significance (p < 0.05) in a t-test between the indicated pair of groups. D Bar graphs represent the mean ± SEM for p-p38 ratios and p38 protein levels as described above

