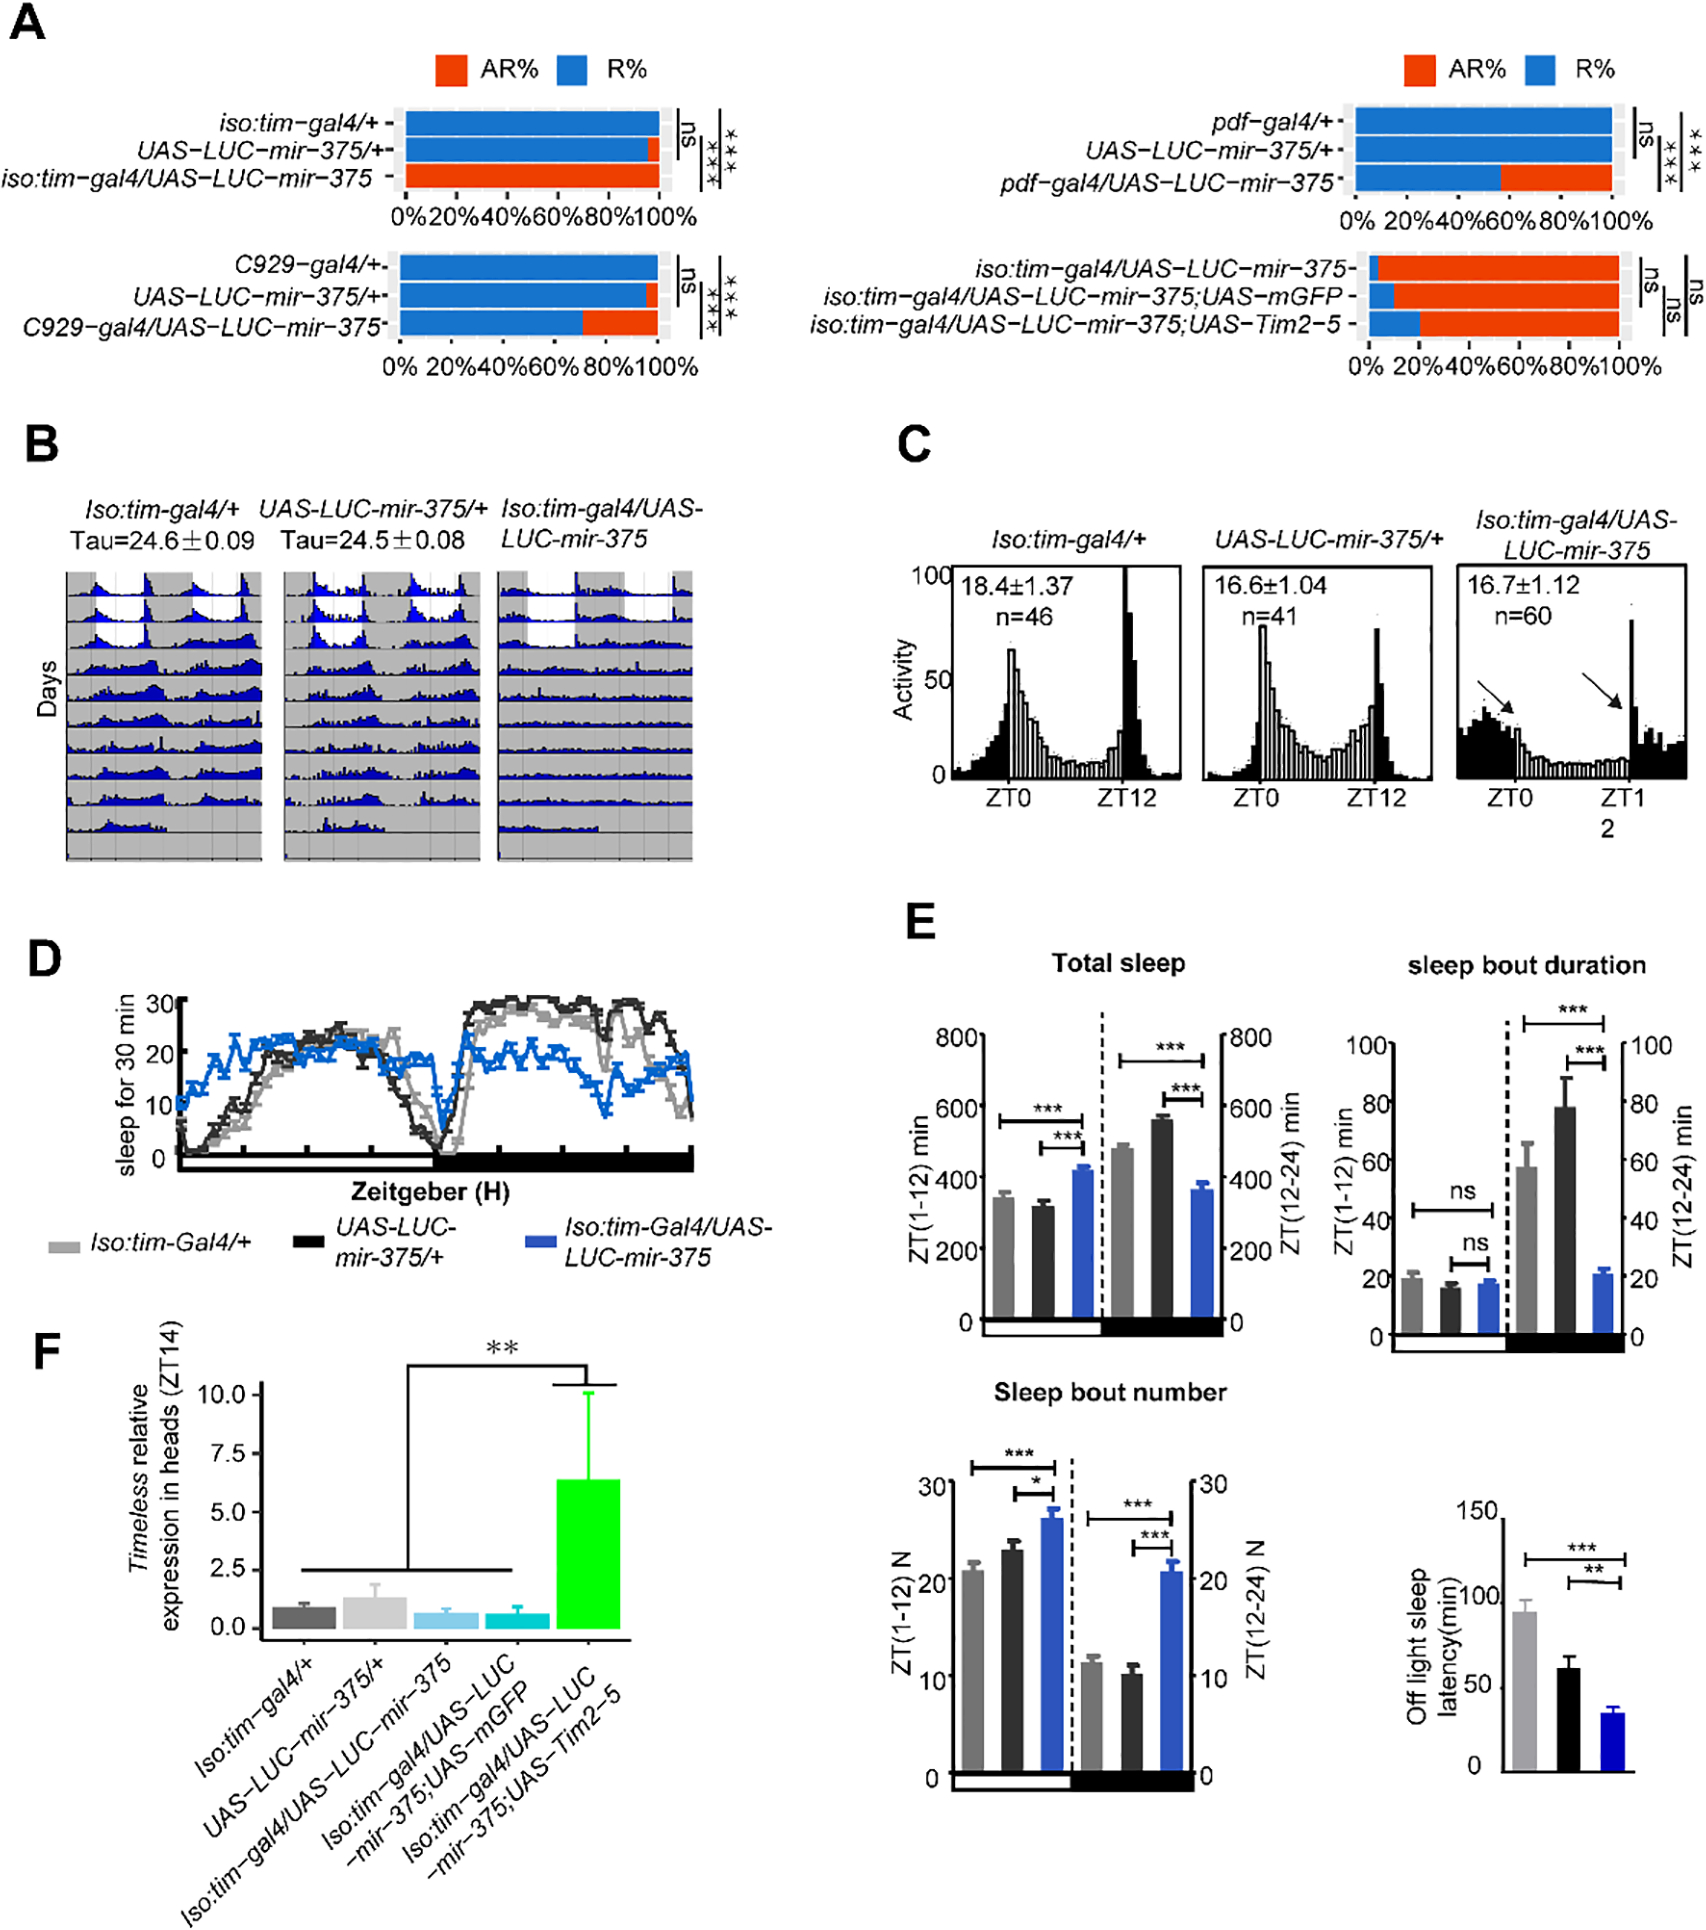
Fig. 4. Overexpression of miR-375 regulates circadian rhythm and sleep.

(A) miR-375 levels affect arrhythmicity in flies. AR% represents the percentage of arrhythmic flies, R% represents the percentage of rhythmic flies. *, p< 0.05; **, p < 0.01; ****, p< 0.0001 (two-tailed t-test).
(B) Locomotor behavior under LD and DD in the flies with miR-375 OE in time neurons. White indicates the light phase; gray indicates the dark phase.
(C) Comparison of the circadian locomotor activity in light/dark cycles of controls and miR-375 OE flies. Histograms represent the distribution of activity through 24 h, averaged over three LD days. Morning and evening anticipation was lost in the flies with miR-375 OE in time neurons.
(D) Sleep traces for male flies with overexpression of miR-375 driven by iso-tim-gal4. Gray dark represents tim-gal4, light dark represents UAS-miR-375, and blue represents tim-gal4/UAS-miR-375.
(E) Sleep profiles of male flies entrained under three LD cycles. Data represent mean ± SEM. **, p<0.01; ***, p< 0.001 (student’s t-test).
(F) Comparison of timeless mRNA levels in the head at ZT14 in flies in the rescue assay. Data represent mean ± SD from three independent experiments. ns, nonsignificant; *, p<0.05; **, p<0.01; ***, p< 0.001 (one way ANOVA test).
