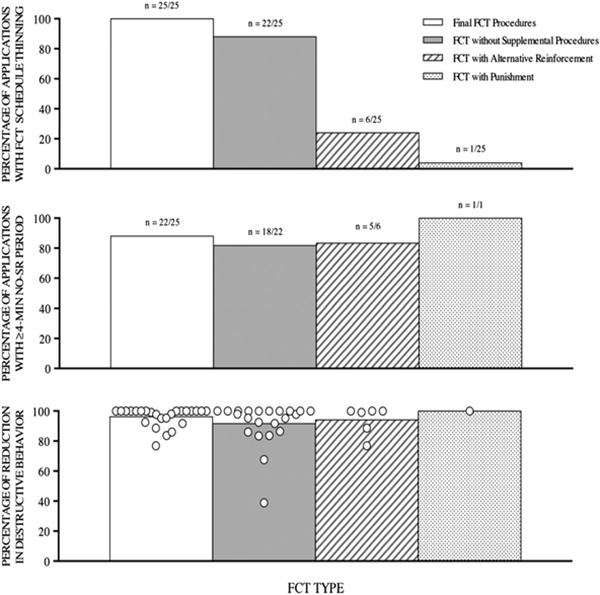
Figure 2.
Reprinted from Greer et al. (2016) Note. Figure illustrates how results are reported in terms of proportion of applications, and findings obtained with each application are depicted separately allowing analysis of the relative distribution of outcomes, as well as differences across conditions or groups.

