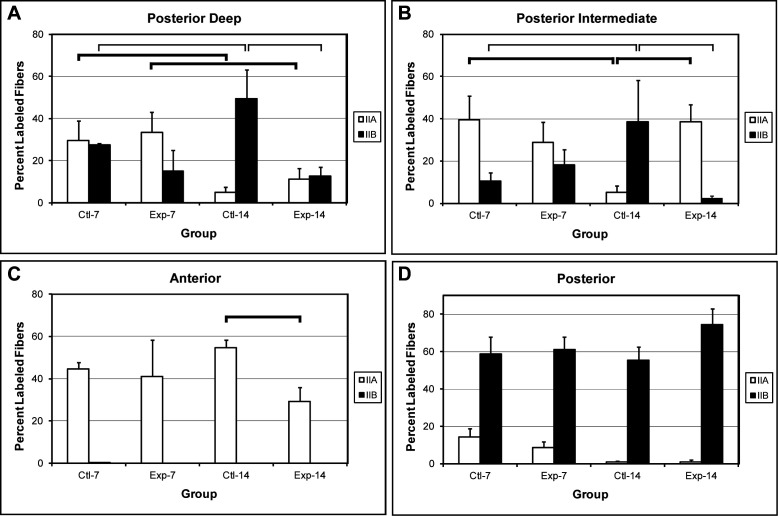
Figure 2. .
Bar graphs illustrating percent labeled MyHC IIa and IIb fibers in the four groups, control and experimental groups at 7 days and 14 days. Statistically significant differences are denoted between groups by horizontal lines: thick lines (MyHC IIa group differences) and thin lines (MyHC IIb group differences) (LSD test, * P < .05). (A) Posterior-deep region. (B) Posterior-intermediate region. (C) Anterior region. (D) Posterior region.

