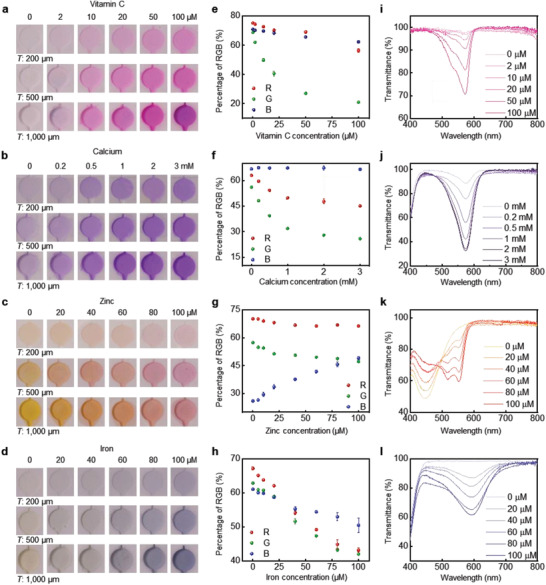
Figure 2.

Quantitative colorimetric analysis of the responses of the nutrient assays by digital image processing and ultraviolet (UV)–visible spectroscopy. Optical images of µ‐reservoirs with different depths at various concentrations of a) vitamin C, b) calcium, c) zinc, and d) iron. Standard calibration curve between the normalized percentage of red, green, and blue levels from RGB analysis of the image and the concentration of e) vitamin C, f) calcium, g) zinc, and h) iron. Each data point in (e–h) indicates the average of measurements for three samples, and the error bars represent the standard deviations. The measured transmittance at various concentrations of i) vitamin C, j) calcium, k) zinc, and l) iron.
