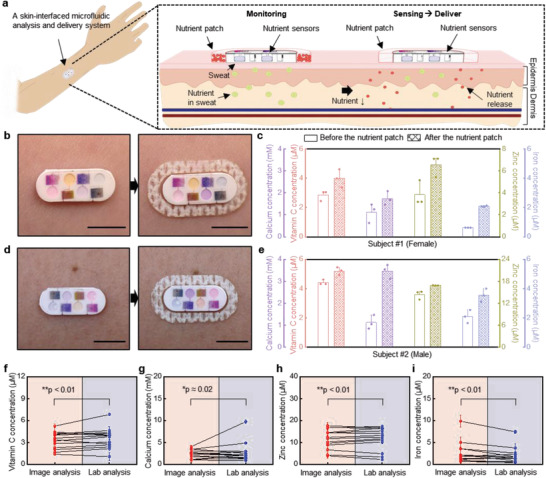
Figure 3.

Human trials of devices for assessment of nutrient concentrations in sweat before and after applying the nutrient patches. a) Schematic illustration of the approach to monitor concentrations of nutrients in sweat and to deliver nutrients using a transdermal patch. b) Image of a device with a nutrient patch captured before and after sweating with subject #1. Scale bars: 0.5 cm. c) The concentration nutrients in the sweat of subject #1 before and after applying patch for 4 h. d) Image of a device with a nutrient patch captured before and after sweating with subject #2. Scale bars: 0.5 cm. e) The concentration nutrients in the sweat of subject #2 before and after applying patch for 4 h. Each data point in (c, e) indicates the average value calculated from three measurements with each device. Error bars correspond to standard deviations. The concentrations of f) vitamin C, g) calcium, h) zinc, and i) iron in sweat obtained by image processing of data from the device versus lab analysis of sweat (n = 7). *p < 0.5, **p < 0.1, two‐tailed test.
