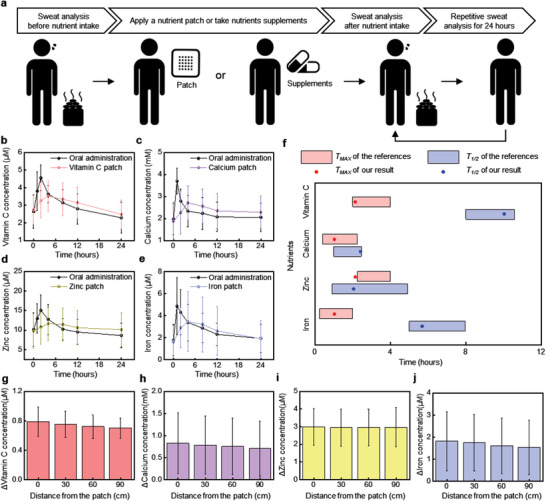
Figure 4.

Comparison of the concentrations of nutrients in sweat across seven subjects following delivery of nutrients via a transdermal patch and multivitamin tablet. a) Cartoon diagram of the experimental protocols. Comparison of the time variation of concentrations of b) vitamin C, c) calcium, d) zinc, and e) iron in sweat at different time intervals after application of transdermal nutrient patches and oral administration of multivitamin tablets. All values are mean ± SD (n = 7). f) Comparison of T Max and T 1/2 between our results for and previous reported results for plasma. The relative change of concentrations of g) vitamin C, h) calcium, i) zinc, and j) iron in sweat at various distances from the nutrient patch. Each subject was measured with a single device.
