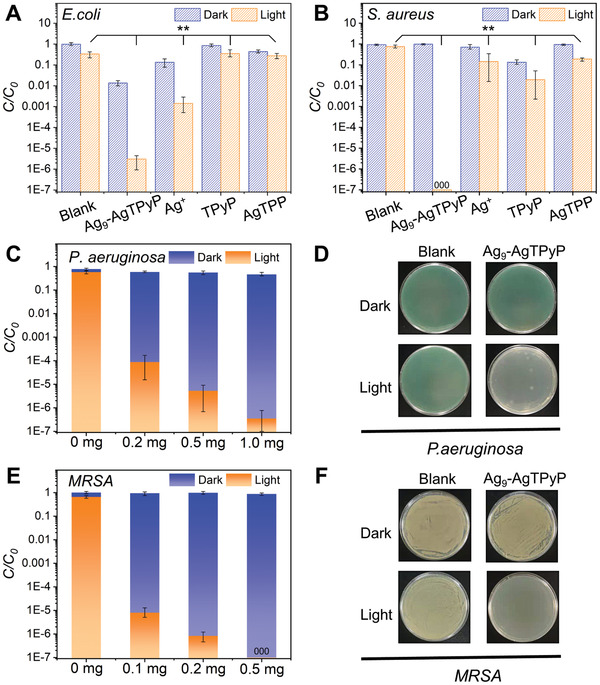
Figure 3.

Antibacterial properties of Ag9‐AgTPyP. Comparison of the photocatalytic antibacterial performance of Ag9‐AgTPyP, Ag+, TPyP, and AgTPP under both light and dark conditions on A) E. coli and B) S. aureus (**p < 0.01). C) Inactivation efficiency of different amounts of Ag9‐AgTPyP toward the antibiotic‐resistant bacteria P. aeruginosa. D) Photos of plate count agars spread with P. aeruginosa before and after photocatalytic disinfection using Ag9‐AgTPyP (0.5 mg). E) Inactivation efficiency of different amounts of Ag9‐AgTPyP toward the antibiotic‐resistant bacteria MRSA. F) Photos of plate count agars spread with MRSA before and after photocatalytic disinfection using Ag9‐AgTPyP (0.5 mg). In the graph of inactivation performance, all bars represent group means. Error bars indicate maximum positive deviation and maximum negative deviation of the mean. p‐Values were calculated using one‐way analysis of variance (ANOVA) (n = 3). The data marked by three zeros (000) on the bar indicate that no live bacteria were detected.
