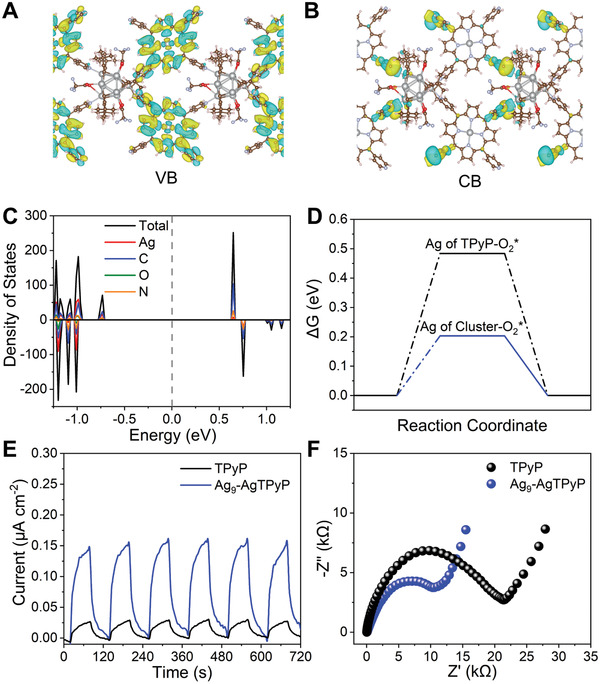
Figure 4.

Theoretical calculations and charge transfer efficiency for Ag9‐AgTPyP. A) The top of the VB and B) the bottom of the CB of Ag9‐AgTPyP calculated by VASP. C) Calculated DOS profiles of Ag9‐AgTPyP. D) Free‐energy diagram of O2 adsorption on active Ag metal sites in AgTPyP (black line) and the Ag9 cluster (blue line). E) Photocurrent responses and F) EIS Nyquist plots for Ag9‐AgTPyP and TPyP.
