Figure 6.

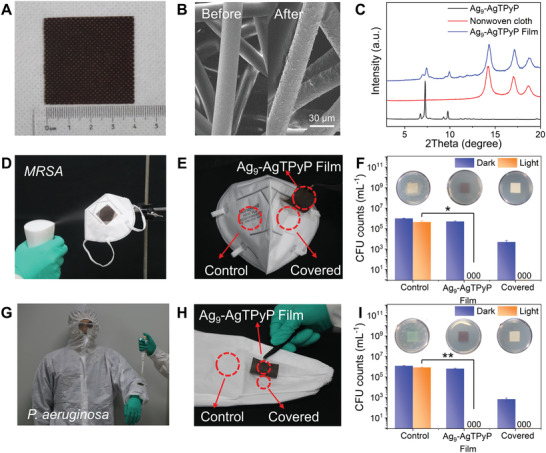
Bioprotection performance of Ag9‐AgTPyP film. A) Optical photograph of Ag9‐AgTPyP film (4 × 4 cm2). B) SEM images of Ag9‐AgTPyP film. C) PXRD patterns of Ag9‐AgTPyP, nonwoven cloth, and Ag9‐AgTPyP film. D) Simulated bacterial aerosols and the interception test by N95 mask. E) Three selected test areas on the mask and F) the relevant CFU count of MRSA, its illustration represents each area of mask washed three times incubated in nutrient agar after 1 h of light irradiation (*p < 0.05). G) Photograph showing the protective suit was loaded with Ag9‐AgTPyP film. H) Three selected test areas on the protective suit and I) the relevant CFU count of P. aeruginosa, its illustration represents each area of mask washed three times incubated in nutrient agar after 1 h of light irradiation (**p < 0.01). All bars represent group means. Error bars indicate maximum positive deviation and maximum negative deviation of the mean. p‐Values were calculated using two‐tailed independent student's t‐test method (n = 3). The data marked by three zeros (000) on the bar indicate that no live bacteria were detected.
