
Figure 1.
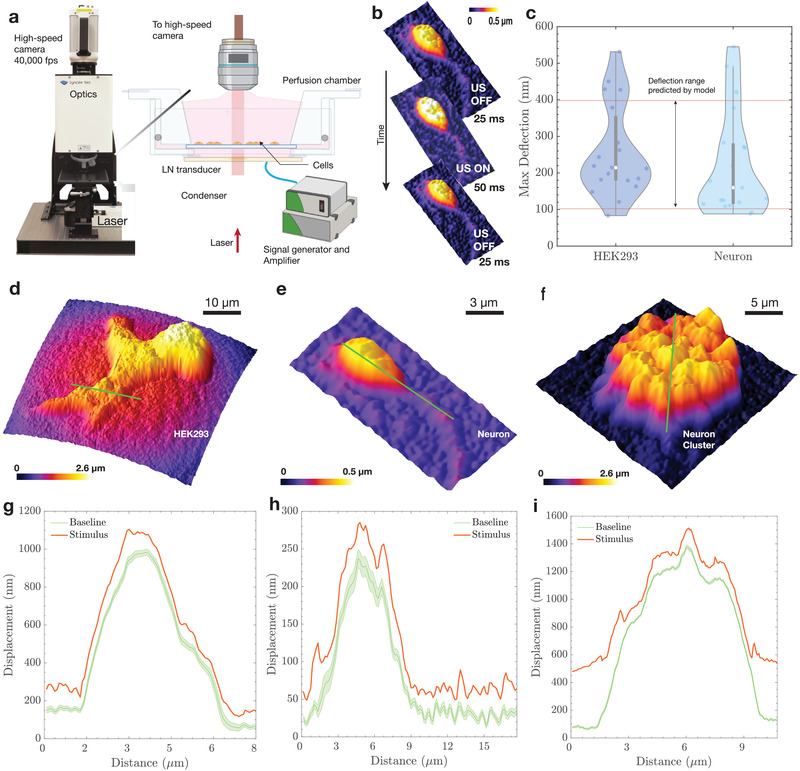
High‐speed DHM imaging of membrane deflection. The deflection of the membrane under the influence of ultrasound was visualized using a) high‐speed digital holographic microscopy (DHM). The DHM setup included a lithium niobate transducer driven by a signal generator and an amplifier at 6.72 MHz. The cells were mounted on a coverslip and placed in a custom perfusion chamber maintained at 37 °C. The DHM enables the b) quantitative reconstruction of phase images acquired by the high‐speed camera at 40 000 frames s−1. Each recording began with 25 ms of no stimulus as a baseline, followed by a 50 ms ultrasound stimulus, and ended with a 25 ms baseline. c) The maximum deflection from the mean position was found to be 100–400 nm, with a median deflection of 214 nm for HEK293 cells and 160 nm for neurons (N = 30 for each cell type). Reconstructed phase profiles are shown for different cell types: d) HEK293 cells, e) neurons, and f) neuronal clusters. Displacement was measured as a function of distance along the green lines provided in the (d–f) contour plots and were g–i) plotted with (red line plot, max displacement during stimulus) and without (green plot, Baseline) ultrasound stimulus. A distance of “zero” in (g–i) is at the left end of the green line in (d) and (e) and at the bottom of the green line in (f). For the (green) baseline displacement, note the mean and 95% confidence intervals are provided. The maximum variation throughout all baseline responses was less than ±20 nm.