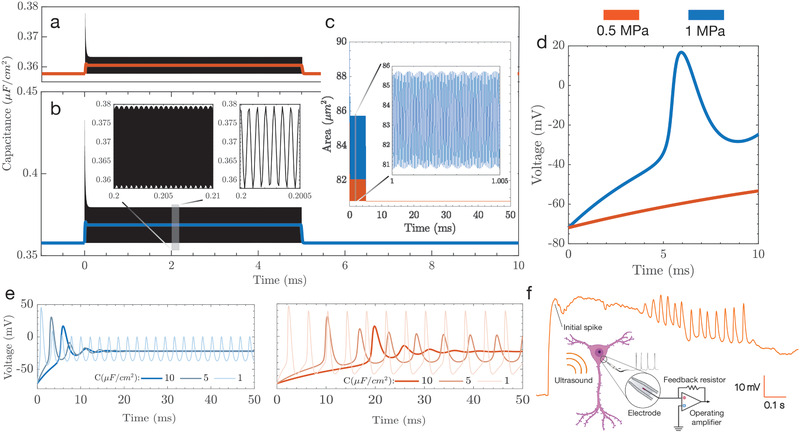
Figure 3.

Displacement driven capacitance changes result in action potential generation. a–e) Simulations help inform the development of stimulus parameters, in terms of time and pressure amplitude; note that throughout (a–e) 0.5 MPa stimulation is red while 1 MPa is blue. The capacitance changes are plotted over the stimulus duration (5 ms) for a) 0.5 and b) 1 MPa with the corresponding area changes that cause c) capacitance fluctuations. The capacitance fluctuations produce depolarization at 1 MPa, but not at 0.5 MPa, indicating d) the presence of a pressure threshold to stimulate neurons. e) Over a longer 50 ms stimulus, the action potential evolves quite differently over time for the two acoustic pressures. At lower pressures, longer stimuli may be necessary to produce action potentials. f) In vitro current clamp electrophysiology was used to verify the predictions of the model and shows that the presence of a preliminary spike followed by oscillations in voltage across the membrane.
