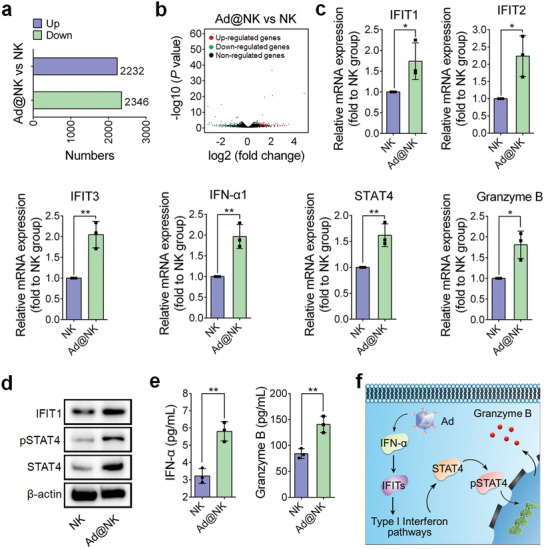
Figure 3.

Ad treatment upregulates immunity‐related pathways in NK cells. a,b) Statistics for the number and proportion of the genes upregulated or downregulated in the transcriptome of Ad@NKs versus untreated NK cells. c) qRT‐PCR, d) western blot, and e) ELISA analyses for the expression levels of the differentially expressed genes (DEGs) (Figure S9b, Supporting Information) and the related immunomodulatory genes in Ad@NKs versus in NK cells. f) Schematic of activated signaling pathways in NK cells in response to Ad stimulation. Data are represented as mean ± SD, n = 3. *P < 0.05; **P < 0.01 denote significant difference.
