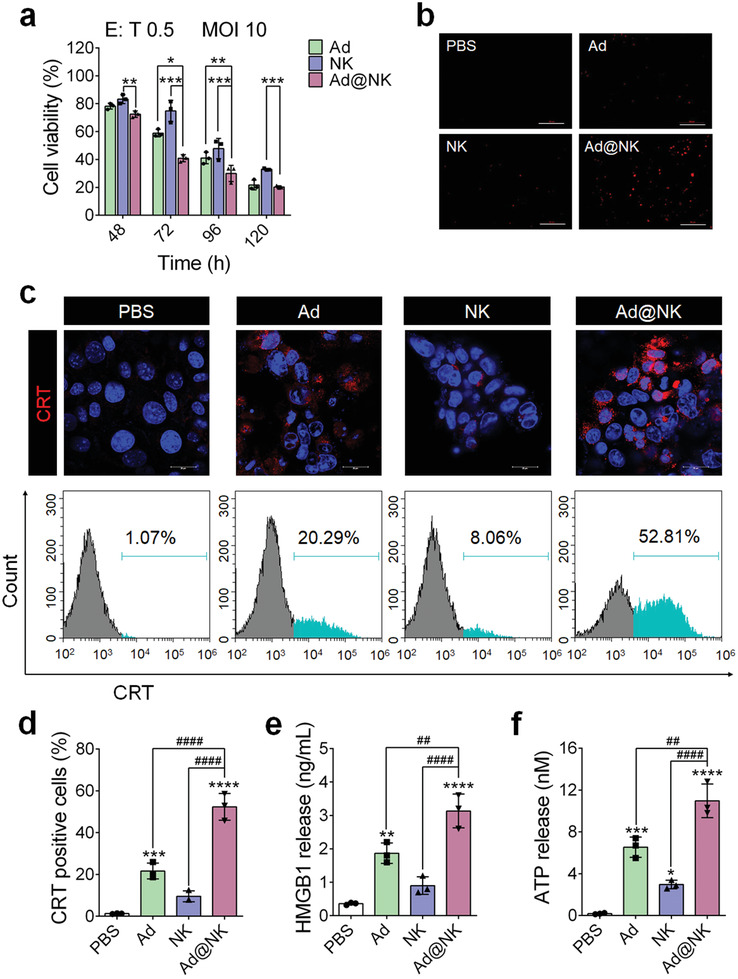
Figure 4.

Ad@NKs possess a higher in vitro tumor cell killing effect than NK cells or Ads alone. a) CCK8 assay was performed to evaluate the cell viability of 4T1 after treatment of Ads (MOI 10), NK cells (E: T = 0.5) and Ad@NKs (MOI 10, E: T = 0.5), respectively. b) TUNEL assay was performed to evaluate the apoptosis of 4T1 cells induced by the treatments of Ads, NK cells or Ad@NKs. Scale bars: 100 µm. c, d) After the treatments of Ads, NK cells or Ad@NKs, the immunofluorescence marking surface‐exposed CRT (red) on 4T1 cells was recorded by laser confocal microscope and flow cytometry detection. Cell nuclei were stained with DAPI (blue). Scale bars: 20 µm. e) ELISA and f) ATP assays were performed to determine the amounts of HMGB1 protein and ATP molecules, respectively, which were released from the 4T1 cells treated with Ads, NK cells or Ad@NKs. Data are represented as mean ± SD, n = 3. *P < 0.05; **P < 0.01; ***P < 0.001; ****P < 0.0001 (vs indicated or PBS); ## P < 0.01; #### P < 0.0001 (vs indicated) denote significant difference.
