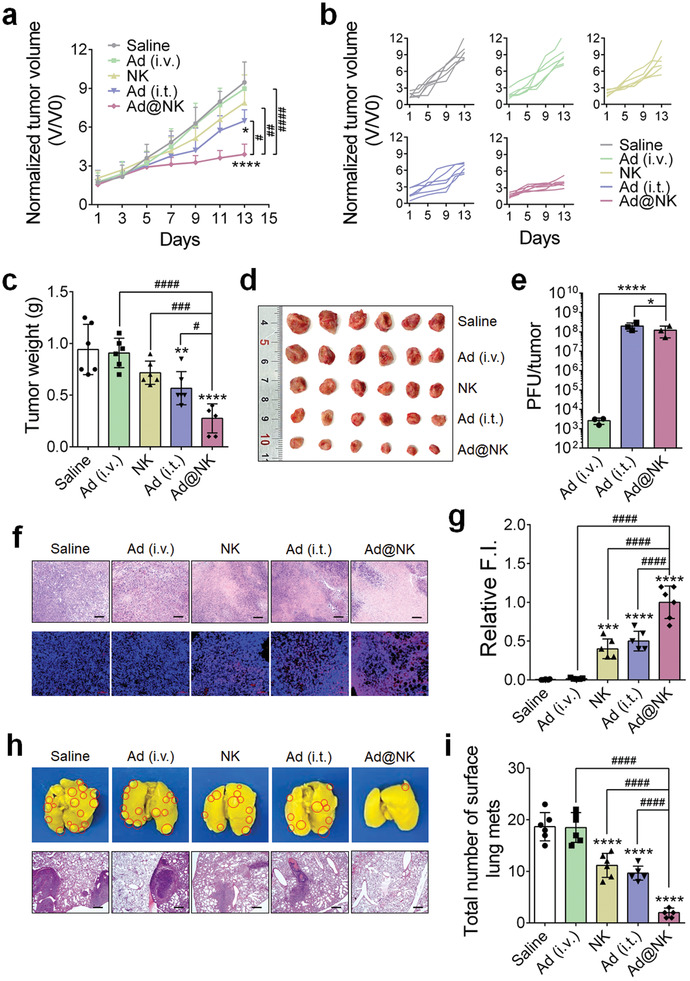
Figure 6.

Ad@NK treatment shows a stronger in vivo inhibitory activity for the primary and metastatic tumors than either of Ad or NK cell single treatment in 4T1‐bearing mice. a) Average or b) individual tumor growth curves in different treatment groups (n = 6). c) Mean tumor weights and d) images of primary tumors in different treatment groups at the end of a 14‐d course of treatment (n = 6). e) Mean numbers of PFU in per tumor in Ad (i.v.), Ad (i.t.) and Ad@NK treatment groups at day 9 post injection (n = 3). f) Representative photographs for the tumor sections which were stained by H&E (scale bars: 100 µm) or TUNEL (scale bars: 50 µm). Cell nucleus: blue; TUNEL: red. g) Relative fluorescence intensity (F.I.) of TUNEL in different treatment groups at day 14 (n = 6). h) Representative photographs for the whole lung tissues and H&E staining of lung sections. Red circles denote metastases. Scale bars: 200 µm. i) Mean number of surface lung metastases at day 14 (n = 6). Data are represented as mean ± SD. *P < 0.05; **P < 0.01; ***P < 0.001; ****P < 0.0001 (vs indicated or Saline); # P < 0.05; ## P < 0.01; ### P < 0.001; #### P < 0.0001 (vs indicated) denote significant difference.
