
Figure 2.
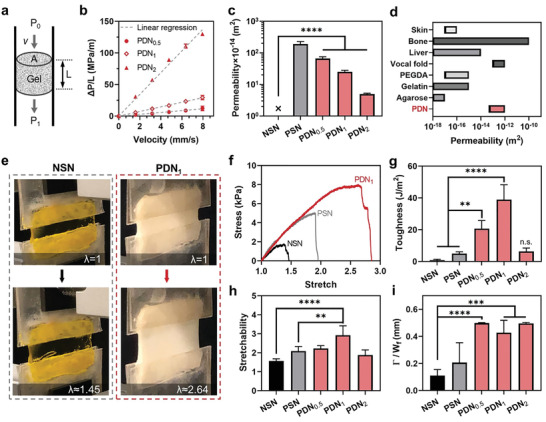
Permeability and toughness of PDNs. a) Schematics of the permeability measurement. The height and cross‐sectional area of the gel are denoted as L and A, respectively. The flow velocity, up‐ and down‐steam pressures are denoted as v, P 0, and P 1. b) Pressure gradient–velocity relations of different gels. c) Permeability of different hydrogels. d) Permeability of different hydrogels and biological tissues (see Table S1 in the Supporting Information). e) Photos showing the stretchability of NSN and PDN1. f) Stress–stretch curves of NSN, PSN, and PDN1. g) Toughness, h) stretchability, and i) fractocohesive length of NSN, PSN, and PDNs. Sample size, N = 4, n.s. represents P ≥ 0.05, ** P < 0.01, *** P < 0.001, **** P < 0.0001.