FIGURE 3.
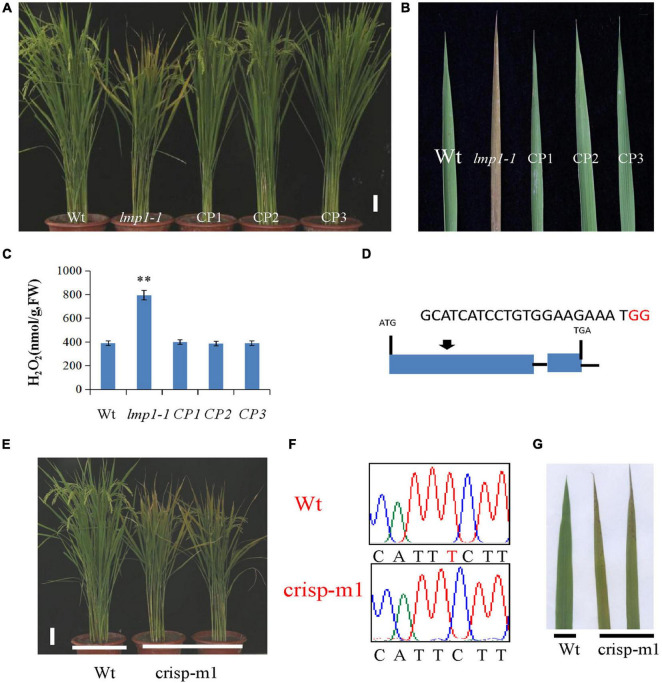
Verification of OsLMP1 by complementation assay and gene editing technology. (A) A complementation assay was conducted using full-length OsLMP1 cDNA. Phenotype comparison of field-grown wt, lmp1-1, and complementation lines (CP1–3) at the flowering stage (bar = 5 cm). (B) Leaves from the wt, lmp1-1, and complementation (CP1–3) lines collected from the plants shown in panel (A) show that complementation restored the lesion mimic phenotype at the flowering stage. (C) The H2O2 content of the wt, lmp1-1, and complementation (CP1–3) lines was measured at the flowering stage (n = 3). The significant differences were marked with asterisks based on student’s t-test (**P < 0.01). (D) Schematic map of the genomic region of OsLMP1 and the sgRNA target site; the arrow shows the sgRNA target site on the OsLMP1 genomic sequence, and the PAM motif (NGG) is shown in red. Blue boxes indicate OsLMP1 exons, and black lines indicate introns. (E) Phenotype comparison of the wt and crisp-m1 homozygous mutants at the flowering stage (bar = 5 cm). (F) The deleted base (1,549) is labeled in red in the wt. (G) Comparison of the wt and crisp-m1 leaves shows that crisp-m1 has the lesion mimic phenotype at the flowering stage.

