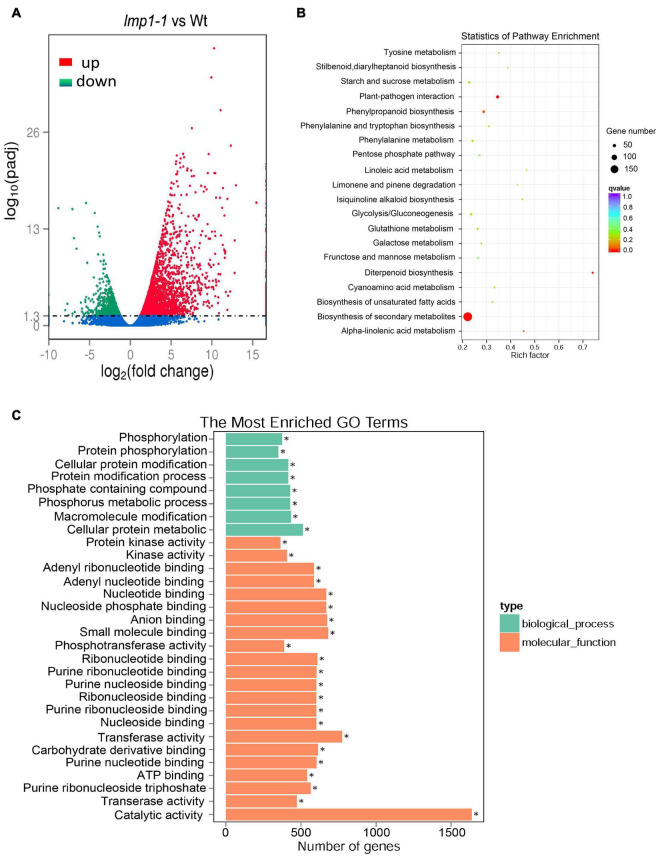
FIGURE 5.
Transcriptome analysis and comparison of the lmp1-1 and wt lines. (A) The X-axis indicates the multiple of the difference after log2 conversion, and the Y-axis indicates the significance value after –log10 conversion for the lmp1-1 and wt lines. Points represent the percentage of the number of DEGs (ratios of the number of DEGs to the total number of detected genes enriched in the same GO terms) identified by paired transcriptome analysis. The numbers of upregulated DEGs are on the right of the backslashes, and the numbers of downregulated DEGs are on the left. vs., versus. (B) KEGG enrichment analysis of the lmp1-1 and wt liens. The X-axis indicates the enrichment ratio (the ratio of the number of genes annotated to an entry in the selected gene set to the total number of genes annotated to the entry in the species). The Y-axis indicates the KEGG pathway, and the size of the bubble indicates the number of genes. The color represents the enriched Q-value; the darker the color is, the smaller the Q-value is. (C) GO annotation of the DEGs from the leaves of the lmp1-1 and wt lines at the later tiller stage. The top 30 GO terms with P < 0.05 are shown here, and more information about the GO annotations is shown in Supplementary Table 2.

