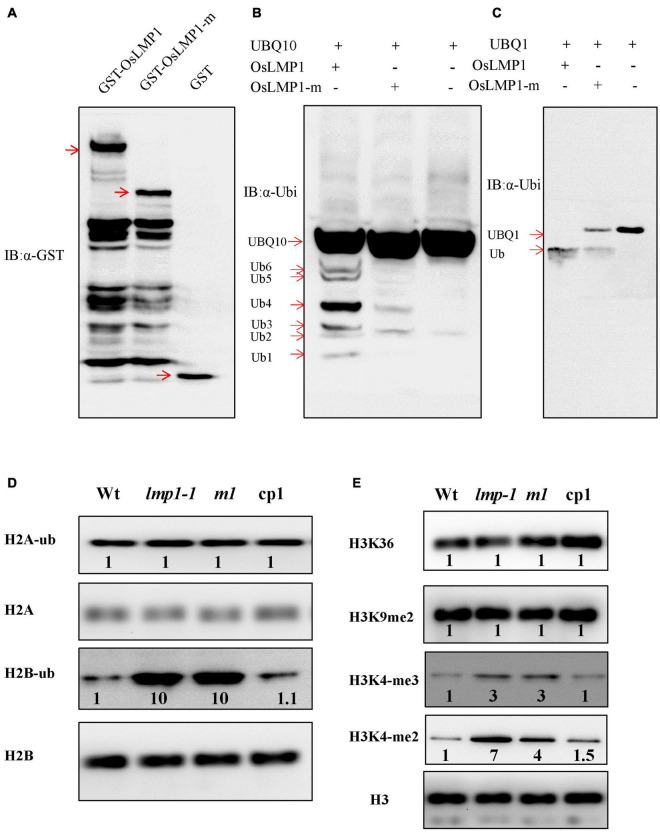
FIGURE 6.
OsLMP1 is an active deubiquitinase. (A) The fused proteins GST-OsLMP1, GST-OsLMP1-m, and GST were purified in E. coli. Western blotting was conducted using an anti-GST antibody. Red arrows denote the expected bands. (B) The fused proteins GST-OsLMP1, GST-OsLMP1-m, and GST were coexpressed with His-UBQ10 in E. coli. Western blotting was conducted using an anti-ubiquitin (α-ubi) antibody. Immunoblot analysis showed that GST-OsLMP1 could cleave His-UBQ10, but GST-OsLMP1-m did not cleave His-UBQ10. Red arrows denoted the ubiquitination precursor bands. (C) The fused proteins GST-OsLMP1, GST-OsLMP1-m, and GST were coexpressed with His-UBQ1 in E. coli. Western blotting was conducted using an anti-ubiquitin antibody (α-ubi). Immunoblot analysis showed that GST-OsLMP1 could cleave His-UBQ1, but GST-OsLMP1-m did not cleave His-UBQ1. Red arrows denoted the ubiquitination precursor bands. (D) Western blot analysis of purified rice histone proteins at the later tiller stage with an anti-H2A/H2B antibody and anti-ubiquitin antibody. The levels of H2B-ub were higher in lmp1-1 and crisp-m1 plants than in wt plants. Band intensities were quantified using ImageJ analysis of the Western blots. The fold change shown above the blot is relative to wt controls normalized by antibody against H2A or H2B in each lane (n = 3). (E) Western blot analysis of purified rice histone proteins at the later tiller stage was conducted with an anti-H3 antibody or specific antibodies. The results show that the levels of H3K4-me2 and H3K4-me3 were higher in lmp1-1 and crisp-m1 plants than in wt plants. Band intensities were quantified using ImageJ analysis of the Western blots. The fold change shown above the blot is relative to wt controls normalized by anti-H3 antibody in each lane (n = 3).

