Figure 3.
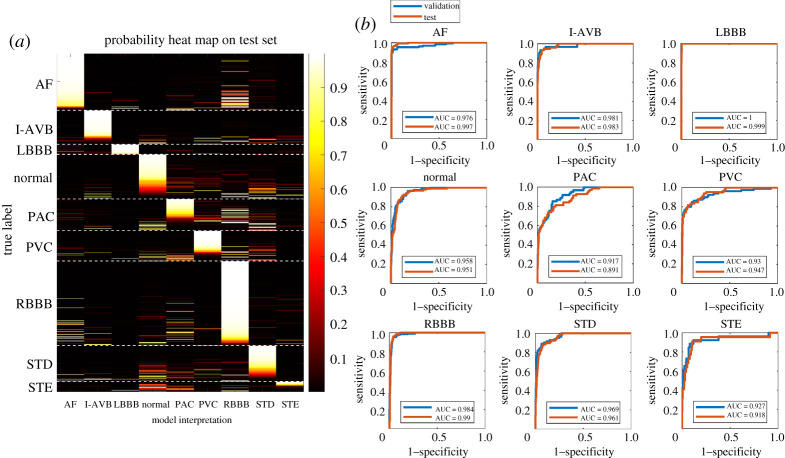
Evaluation of our model using the optimal ECG-lead subset (II, aVR, V1, V4) in the classification of the ECG abnormality types. (a) A heat map illustrates the interpretation output in probabilities of the ECG abnormality types on the held-out test set using the optimal ECG-lead subset. From a vertical view, the distribution of the bright bars in a column reflects the performance of detecting a specific ECG abnormality from population. For instance, in the column of LBBB, the bright bars aligned well with the true LBBB patients, reflecting an excellent performance in LBBB detection. From a horizontal view, whether bright bars concentrate in the correct column reflects the performance of classifying a recording to its true abnormality class out of nine labels. For instance, in the rows of AF patients, the bright bars concentrated in the AF column correctly, but there are several bright bars in the RBBB column, which could be due to multi-labelled recordings or misclassification. (b) ROC curves show the classification performance of our model for interpreting each of the ECG abnormality types on the validation and held-out test sets. (Online version in colour.)

