Figure 2.

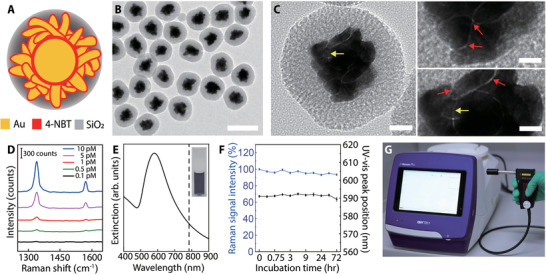
Characterization of GERTs. A) Schematic structural diagram of a GERT. Internal nanogaps in the core–shell structure and the rough petal‐like shell are decorated with Raman reporters of 4‐NBT and the particle is protected by a mesoporous silica layer. B) TEM image of a population of GERTs. The scale bar is 100 nm. C) Enlarged TEM images of a single GERT with multiple sub‐nanometer nanogaps (indicated by red and yellow arrows). The scale bars are 20 (left) and 5 nm (right). D) The detection limit of aqueous GERTs is 0.5 × 10⁻¹² m (785 nm, 5.0 × 10³ W cm−2 power density, and 0.2 s acquisition time). E) Extinction spectrum of aqueous GERTs. The inset shows the corresponding photograph of aqueous GERTs (2.0 × 10⁻⁹ m). The dashed line indicates the laser excitation wavelength at 785 nm. F) Stability measurements of the GERTs in terms of extinction spectrum and Raman signal intensity (1340 cm−1). Data are means ± SD (n = 3). G) Photograph of a hand‐held Raman scanner.
