Figure 3.

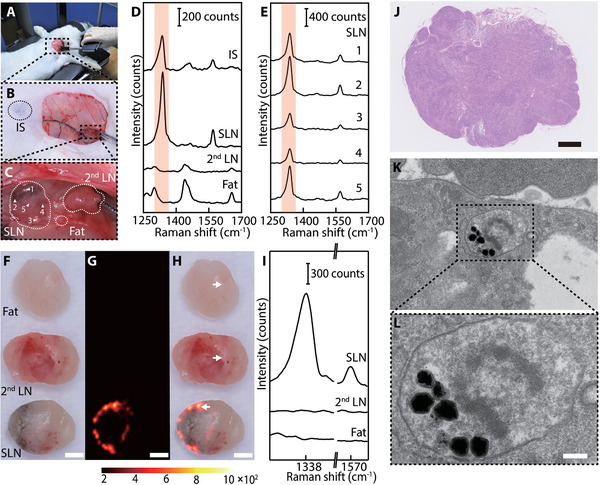
In vivo intraoperative LN tracing and ex vivo LN Raman imaging 10 min after injection of GERTs. A) Real‐time LNs tracing with a hand‐held Raman scanner (785 nm, 5.0 × 10³ W cm−2 power density, 0.2 s acquisition time). Raman signals were collected on the injection site (IS), LNs, and fat. B) Photograph of a rabbit after GERTs injection and skin removal. The black circle indicates the IS. C) Enlarged area (18 ×) indicated in panel (B). The white circles indicate the SLN, 2nd LN, and the fat tissues. Raman spectra D) from different positions and E) five representative in situ scanning points (1: top, 2: left, 3: bottom, 4: right, 5: center) on the SLN. F–H) Photograph, Raman image, and the overlay of a dissected SLN, 2nd LN, and adjacent fat tissue. Raman image was plotted using the Raman band at 1340 cm−1 (shaded area in (D)). I) Characteristic Raman signal of the position which marked by white arrows (in panel (H)) on the dissected SLN, 2nd LN, and fat. J) H&E‐stained micrograph of a SLN section after GERTs injection. K,L) Bio‐TEM images of GERTs distributed in the organelle of lymphocyte. The scale bars are F–H) 1 mm, J) 500 µm, and L) 100 nm.
