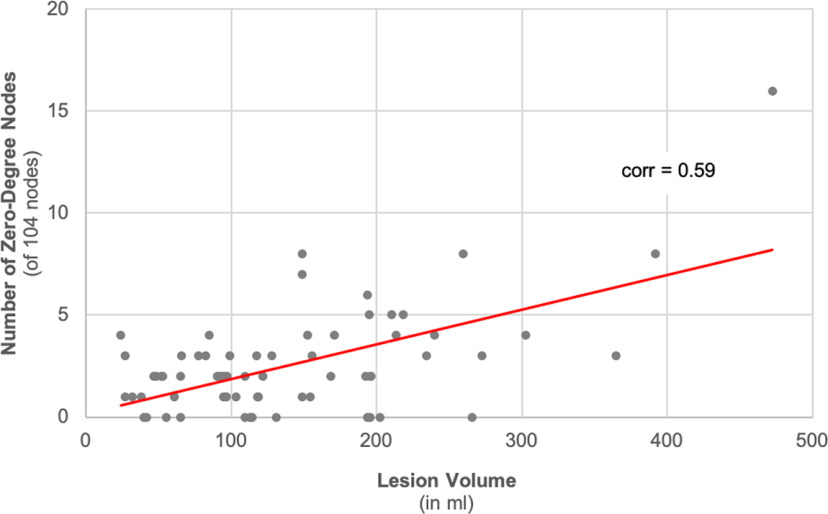
Figure 5.
Scatter plot of total brain lesion volume versus number of zero-degree nodes. Zero-degree nodes were calculated across all 104 gray matter anatomic regions. The number of zero-degree nodes was overall related to the total brain lesion volume (Pearson correlation coefficient = 0.59; p < 0.001). corr = Pearson correlation coefficient.

