
Figure 6.
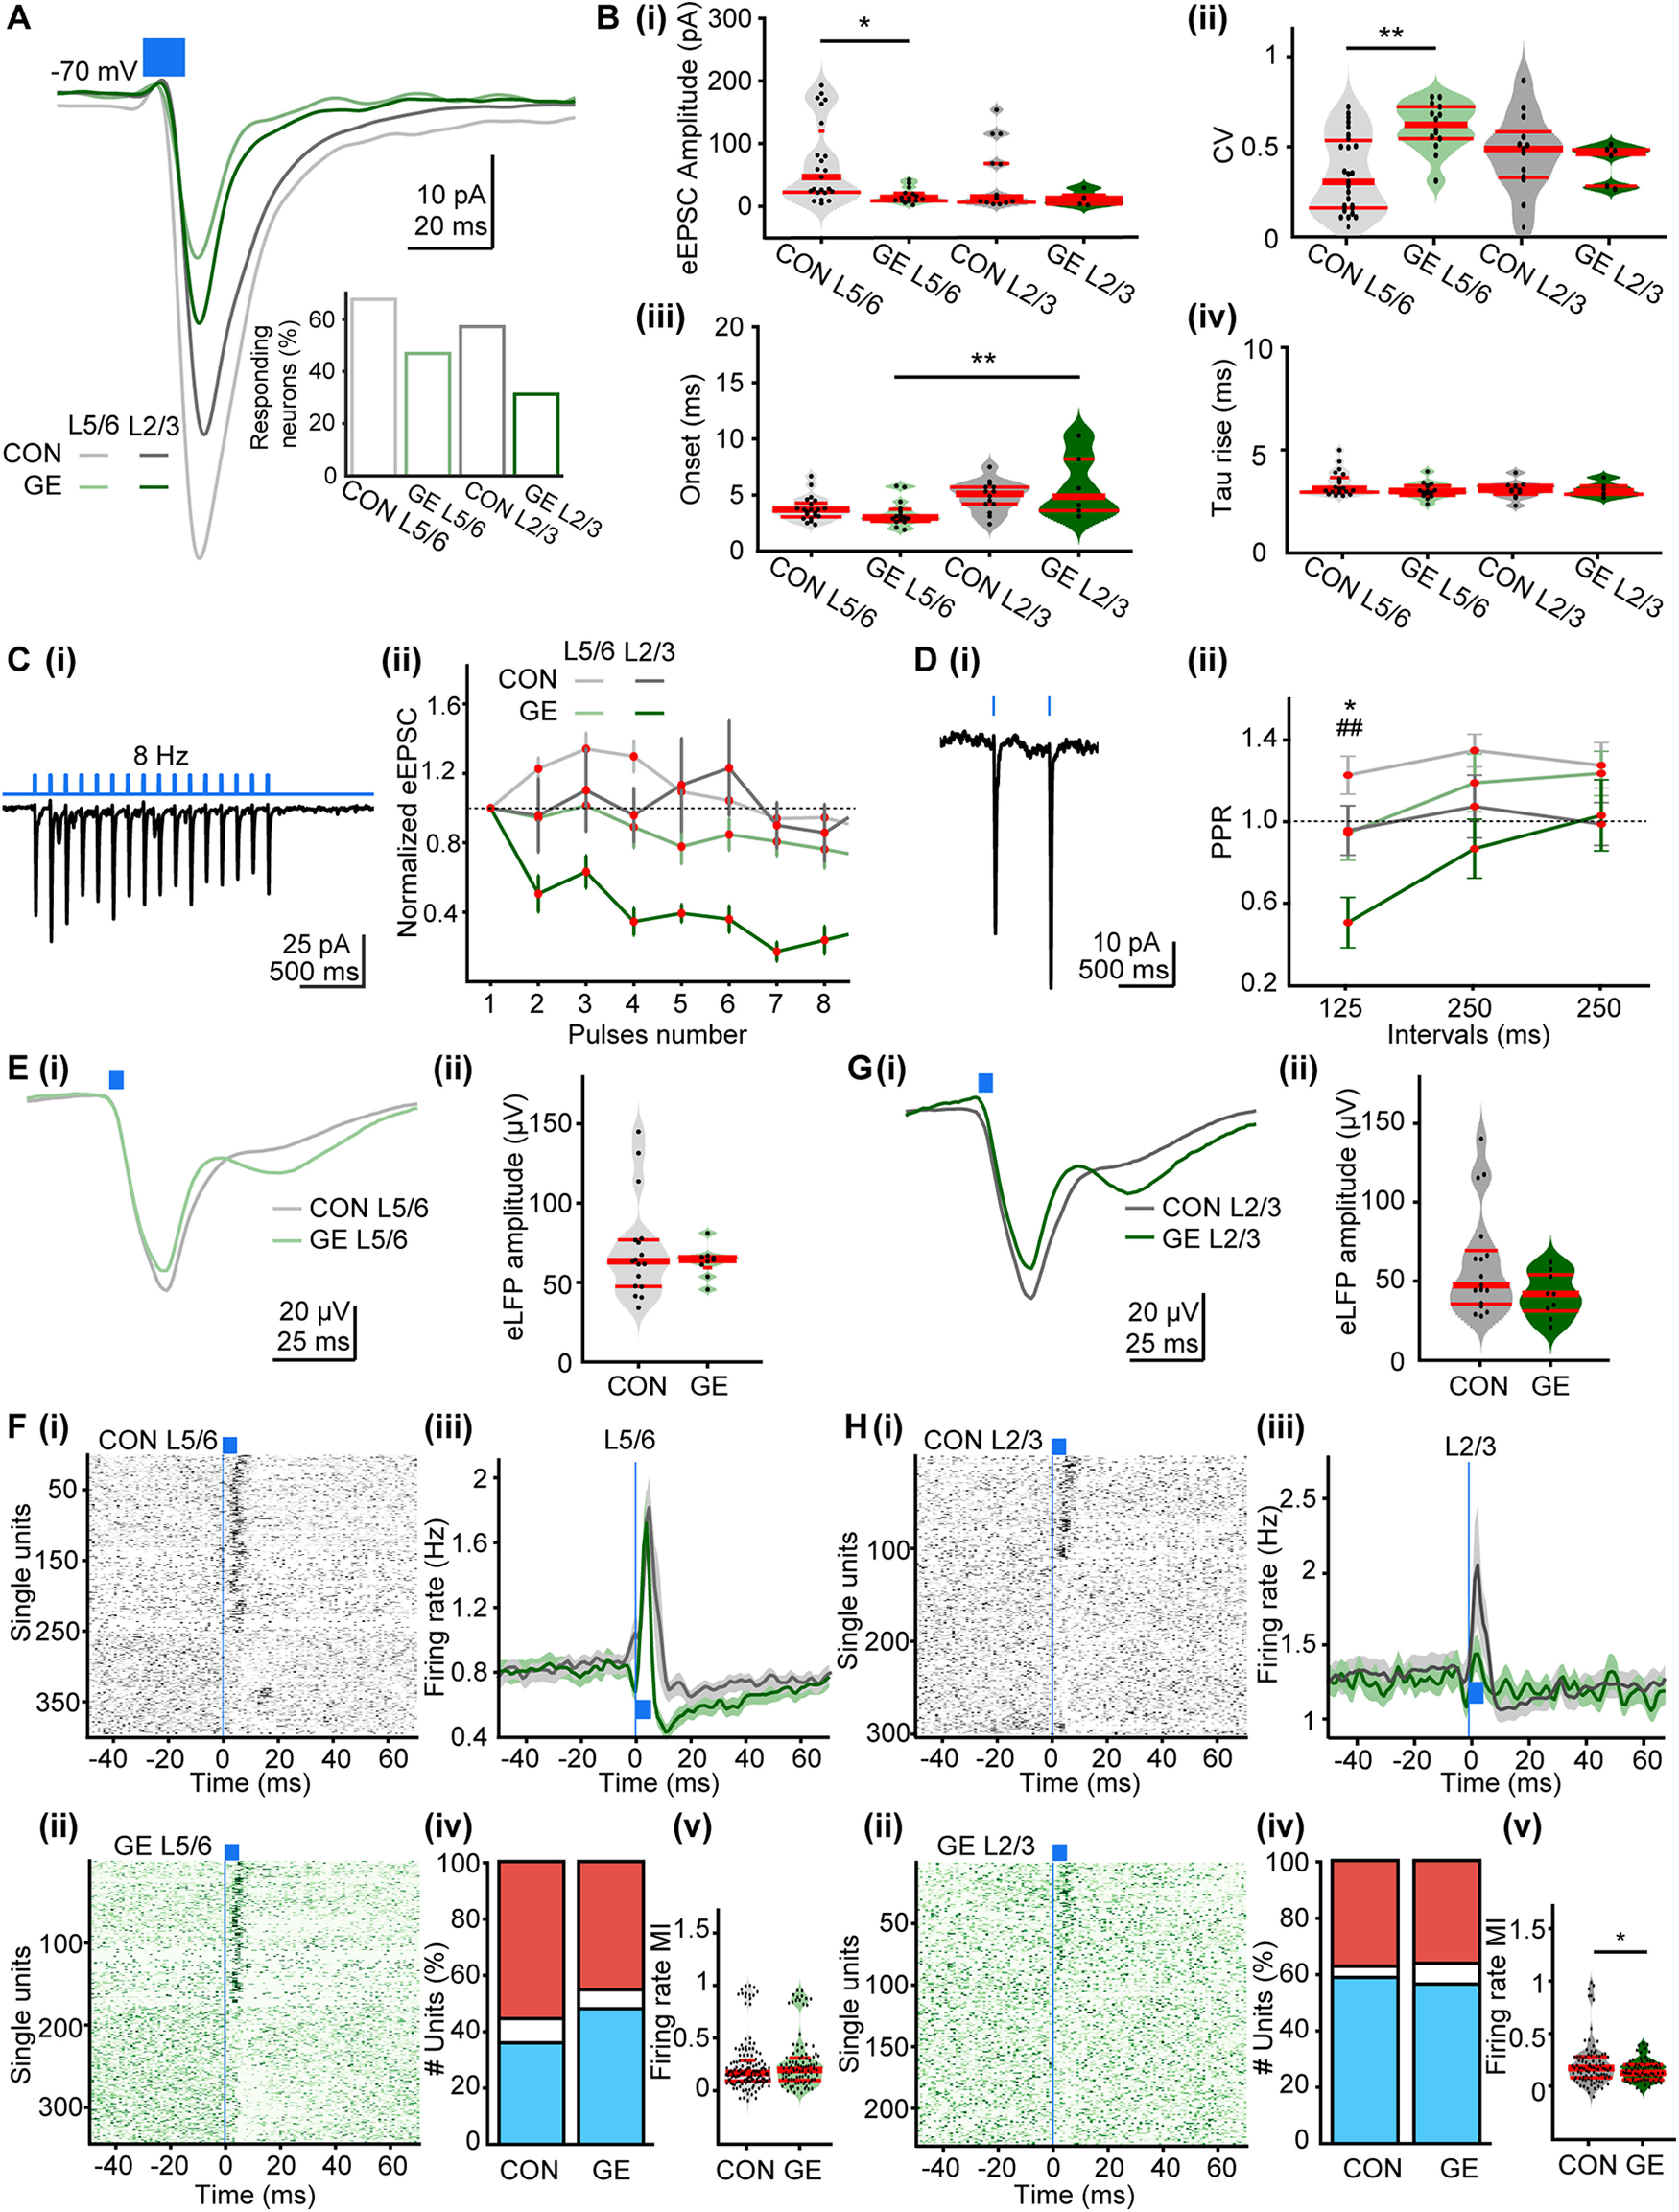
Responses of PL during optogenetic activation of hippocampal terminals in prejuvenile CON and GE mice in vitro and in vivo. A, Averaged eEPSC (holding potential of –70 mV) evoked by light in layer 5/6 (n = 23) and layer 2/3 (n = 15) neurons from prejuvenile CON mice as well as in pyramidal neurons in layer 5/6 (n = 12) and layer 2/3 (n = 6) from prejuvenile GE mice. Blue bar corresponds to 10-ms light stimulation. Inset, Bar diagram of the percentage of responsive pyramidal neurons in different groups. B, Violin plots showing the (i) amplitudes, (ii) CV of amplitudes, (iii) synaptic delay, and (iv) rise tau of eEPSCs averaged for all prefrontal neurons in CON and GE mice. Ci, Representative current response to pulsed light (8 Hz; blue) of a layer 5/6 pyramidal neuron from a P21 CON mouse. ii, Plot of eEPSC amplitude (normalized to the first EPSC amplitude) in response to 8-Hz stimulation averaged for all prefrontal neurons in CON and GE mice. Di, Representative response to light stimuli (500-ms interstimulus interval) of a layer 5/6 pyramidal neuron from a P21 CON mouse. ii, Plot of PPR at 125-, 250-, 500-ms interstimulus intervals averaged for all prefrontal neurons in CON and GE mice; * for comparison of layer 5/6, ## for comparison of layer 2/3. Ei, Averaged LFP response recorded in PL layer 5/6 in response to light stimulation (blue bars) of HP terminals in CON (gray) and GE (green) mice. ii, Violin plots showing the average amplitude of the maximum LFP response evoked by light in layer 5/6 of CON and GE mice. Fi, Raster plot depicting the firing of single PL cells in response to pulse stimulation of hippocampal terminals in layer 5/6 of CON mice. ii, Same as i, for GE mice. iii, Firing rate of all units in layer 5/6 around the pulse stimulation averaged for CON (gray) and GE (green) mice. iv, Stacked bar plot showing the percentage of activated (red), unmodulated (white), and inhibited (blue) units after pulse stimulation of PL layer 5/6 of CON and GE mice. v, Violin plots showing the MI of firing rate of all activated units in layer 5/6 of CON and GE mice. G, Same as in E, but for the stimulation in layer 2/3 of PL. H, Same as in F, but for spike response of single prefrontal cells to pulse stimulation of hippocampal terminals in layer 2/3. Single data points are represented as dots and the red horizontal bars in violin plots correspond to the median and the 25th and 75th percentiles; *p < 0.05, **p < 0.01, ##p < 0.01.