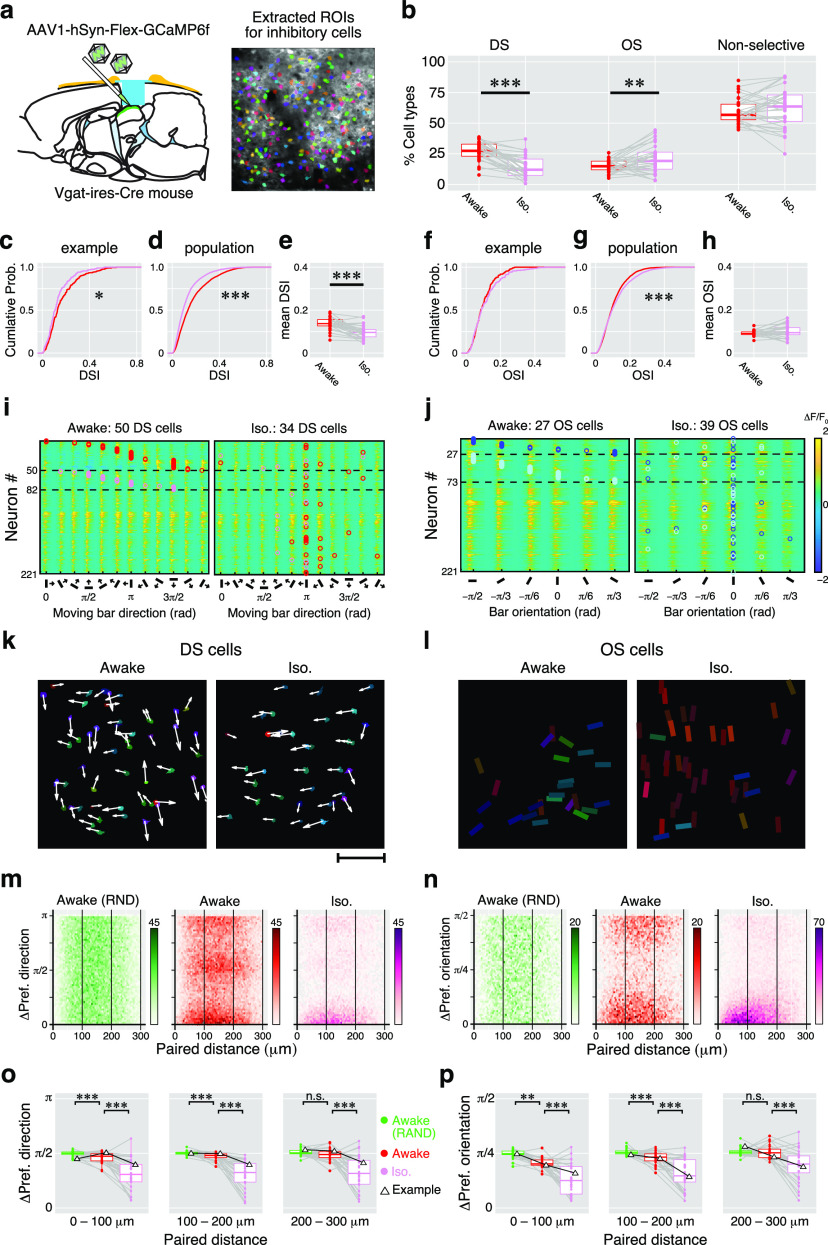
Figure 7.
Summary of isoflurane effects on direction and orientation responses of inhibitory sSC neurons. a, Cre-dependent GCaMP expression into the inhibitory neurons and the extracted ROI image. b, Proportions of DS cells, OS cells, and nonselective cells. Dots indicate the mean proportions of the three response types in awake (red) and iso (pink) conditions recorded from 30 imaging sites. Gray lines indicate each pair (awake vs iso). c–e, Changes in the DSI. c, The cumulative probability of DSI in an example site (awake, 217 cells; iso, 204 cells). d, The cumulative probability of DSI in 30 imaging sites (awake, 5213 cells; iso, 4568 cells). e, Comparison of changes in mean DSIs. Dots indicate the individual mean DSI from 30 imaging sites. f–h, Changes in OSI are shown with cumulative probabilities and paired comparison of mean OSIs, as in c and d. Red symbols indicate the data from the awake condition, and pink symbols indicate those from the isoflurane condition. Gray lines connect paired data (awake vs iso). i, j. Color maps show the averaged Ca2+ responses to 12 moving-bar stimuli of 221 inhibitory neurons recorded from an example imaging site (DS responses, i; OS responses, j). k, Locations of the DS cells shown in i mapped onto the field of view. Scale bar, 100 μm. l, Locations of the OS cells shown in j. Arrows and bar angles indicate their preferred direction and orientation, respectively, using the same format shown in Figure 5. m, n, 2-D histograms of the absolute differences in the preferred directions (m) or preferred orientations (n) versus horizontal distance of all pairs of inhibitory neurons from 30 imaging sites. The color intensity of each dot indicates the number of pairs according to the scale shown to the right. o, p, Comparison of local similarity of the preferred direction (o) and preferred orientation (p) of cells in the RND (green), awake (red), and iso (pink) conditions. Dots indicate the mean differences of preferred directions from each imaging site for each 100 μm step in the distance of the neuron pairs. Data from the example mouse (i–l) are shown with triangles. n.s.: not significant.

