Figure 8.
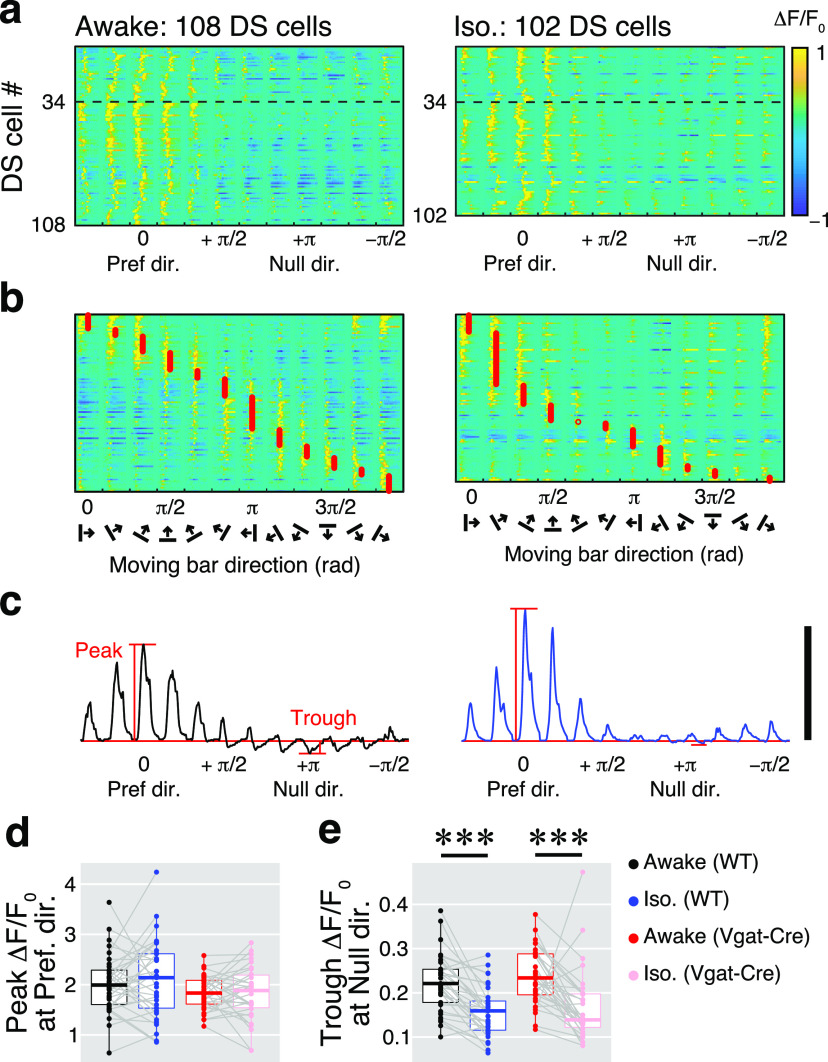
The inhibitory effect of isoflurane on responses in the null direction of DS cells. a, Color maps indicate Ca2+ responses of 108 DS cells in the awake condition (left) and 102 DS cells under isoflurane anesthesia (right) from the same example imaging site. The amplitude of the ΔF/F0 is color coded according to the color bar to the right. Responses are aligned by the preferred direction of individual DS cells at 0 in the x-axis. Thirty-four neurons above the dotted line showed direction selectivity in both conditions. b, The same neurons recorded in a are shown as a function of stimulus directions (approximate preferred directions are indicated by red circles). c. Averaged ΔF/F0 traces of 108 DS cells in the awake condition (left) and 102 DS cells under isoflurane anesthesia (right). Horizontal red lines are the baselines. Calibration: 1 ΔF/F0. d, e, Comparisons of peak (d) and trough (e) amplitudes of the awake and isoflurane conditions. Black and blue dots are data from the wild-type mice. Red and pink are data from the inhibitory neurons in the Vgat-ires-Cre mice.

