Figure 4.

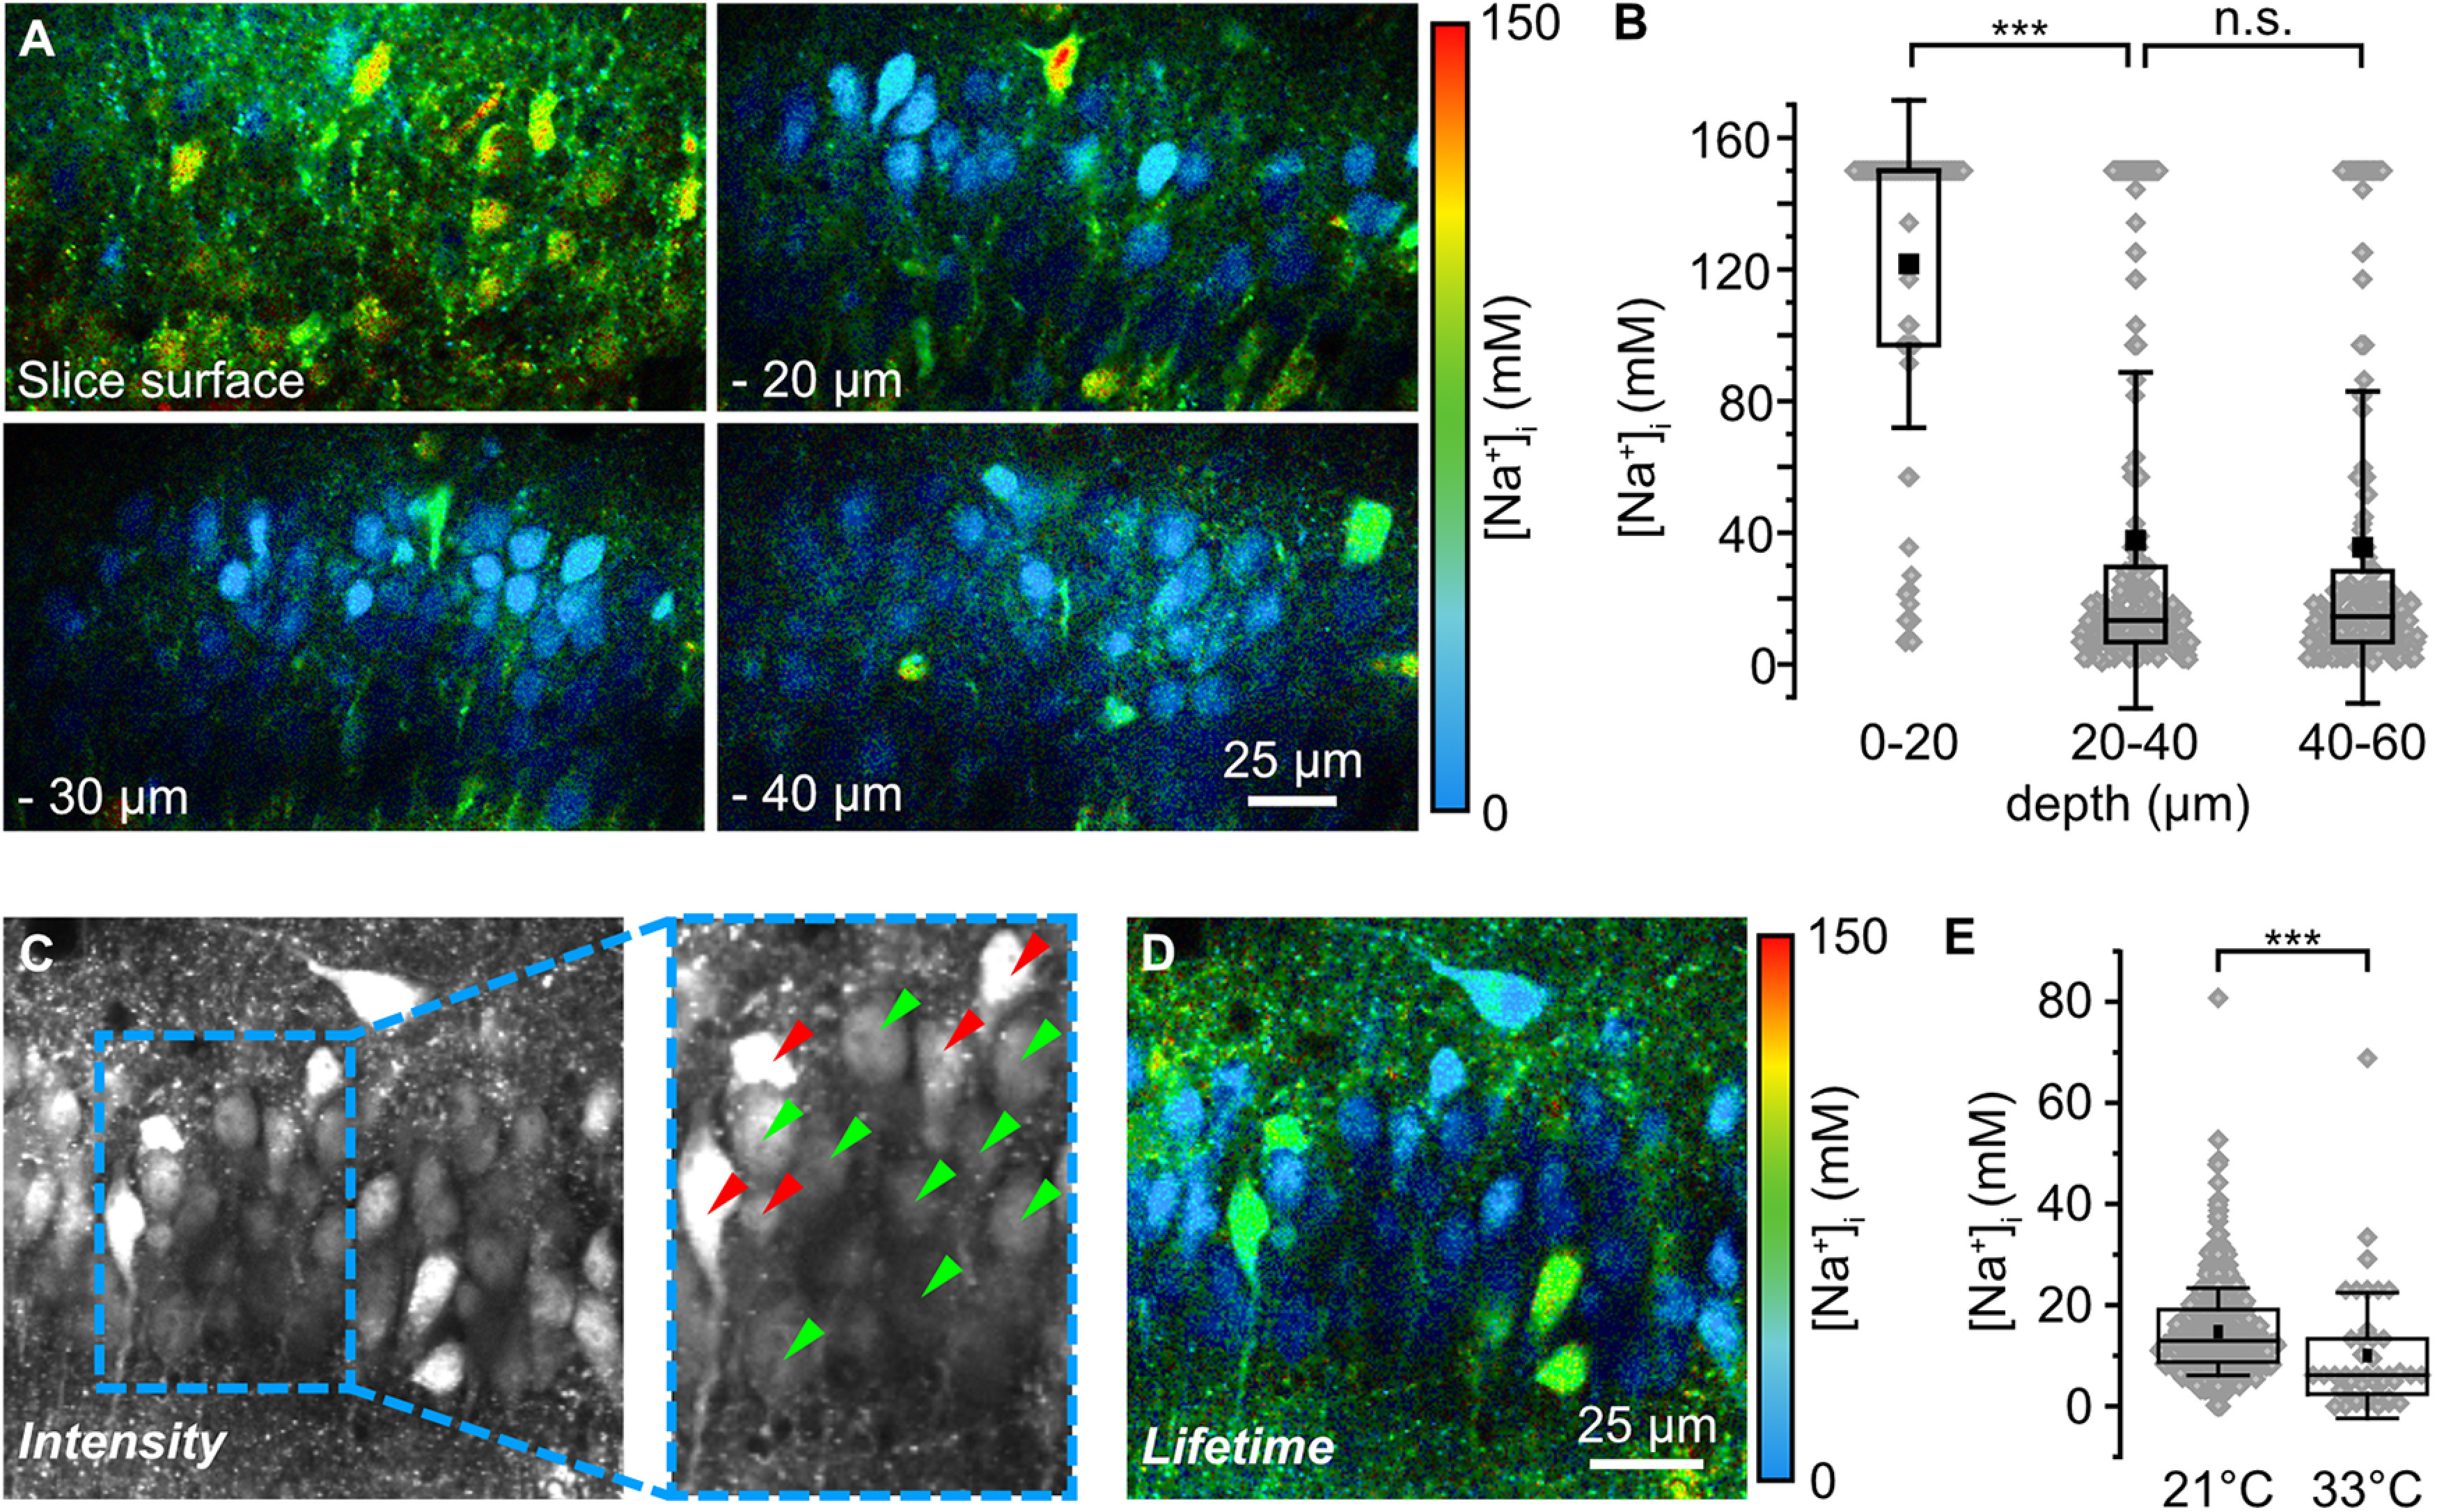
Baseline [Na+]i of CA1 pyramidal neurons in acute tissue slices. A, Color-coded FL images of the CA1 pyramidal cell layer of an ING2-loaded acute tissue slice at different depths (slice surface, −20, −30, and −40 µm). Images are depicted with a 30 s temporal binning; cyan colors represent low [Na+], red colors represent high [Na+] as indicated by the bar (right). B, Box plots illustrating baseline [Na+] of neurons at the slice surface (n = 91), at depths of 20–40 µm (n = 358) and of 40–60 µm (n = 246). Note that the distribution of [Na+]i across all cells was similar (p = 0.49) between 20–40 µm and 40–60 µm. C, Intensity image (temporal binning of 30 s) of an ING2-loaded acute slice taken at a depth of −25 µm. Inset, A magnification of 1.5× (right). Green arrowheads mark cells that were analyzed further based on their morphologic appearance and brightness in the intensity image. Red arrowheads point to cells that were excluded from further analysis based on the same criteria. D, Color-coded FL image (temporal binning of 30 s) of the same region depicted in C. E, Box plots illustrating baseline [Na+] of neurons at 21°C (n = 397, N > 5) and 33°C (n = 44, N = 5) at a depth between −20 and −60 µm. B, E, Box plots show mean (square), median (line), 25/75 percentiles (box), SD (whiskers), and single data points (gray diamonds). One-way ANOVA with Tukey's post hoc tests were used for normal distributed data; otherwise, Mann–Whitney tests were used; ***p < 0.001.
