Figure 6.
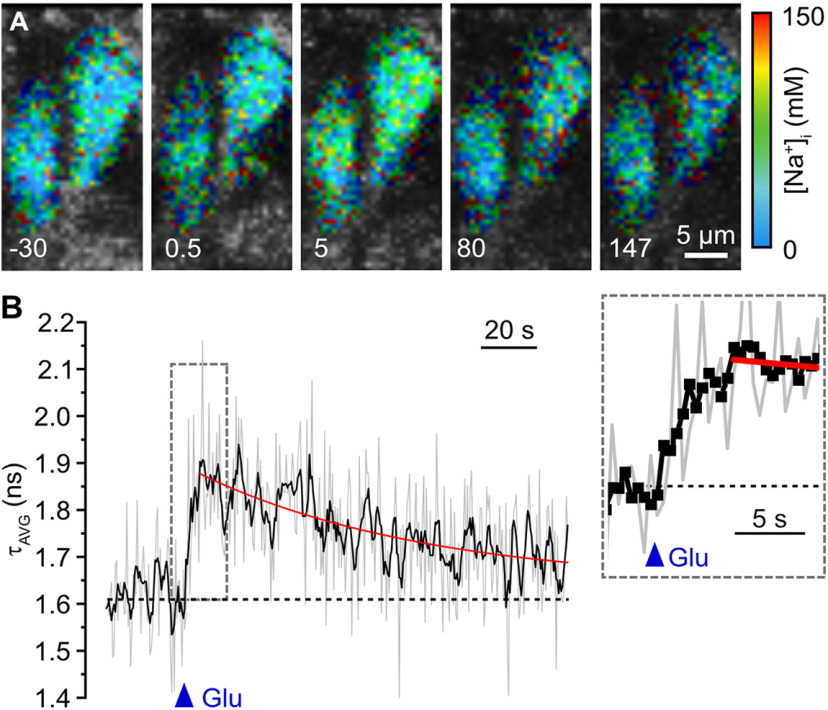
Glutamate-induced changes in ING2-FL. A, Color-coded fluorescence lifetime images (excerpts, 28 × 56 pixels) of the soma of a CA1 neuron in an ING2-loaded acute tissue slice. Right, Color code. An experiment in which the frame size was cropped to 56 × 56 pixels; frame rate was 10 Hz. Images depicted are bins of five frames, resulting in a final temporal resolution of 2 Hz. Numbers (−30, 0.5, 5, 80, and 147) are the corresponding time points, with 0 corresponding to the moment of a pressure application of glutamate (1 mm/200 ms). Note the change in image brightness (intensity/photon count) and color (fluorescence lifetime) in response to glutamate. B, Same experiment as in A showing glutamate-induced changes in fluorescence lifetime (τAVG; 5 frames binned). Gray lines, raw data of four cells; black lines, rolling average of the raw data; red line, monoexponential fit of the recovery phase. Blue triangle, time point of glutamate application. Inset, The τAVG at 5× higher temporal resolution; black squares represent individual data points of the averaged trace. Scale bar, 5 µm.

