Figure 7.

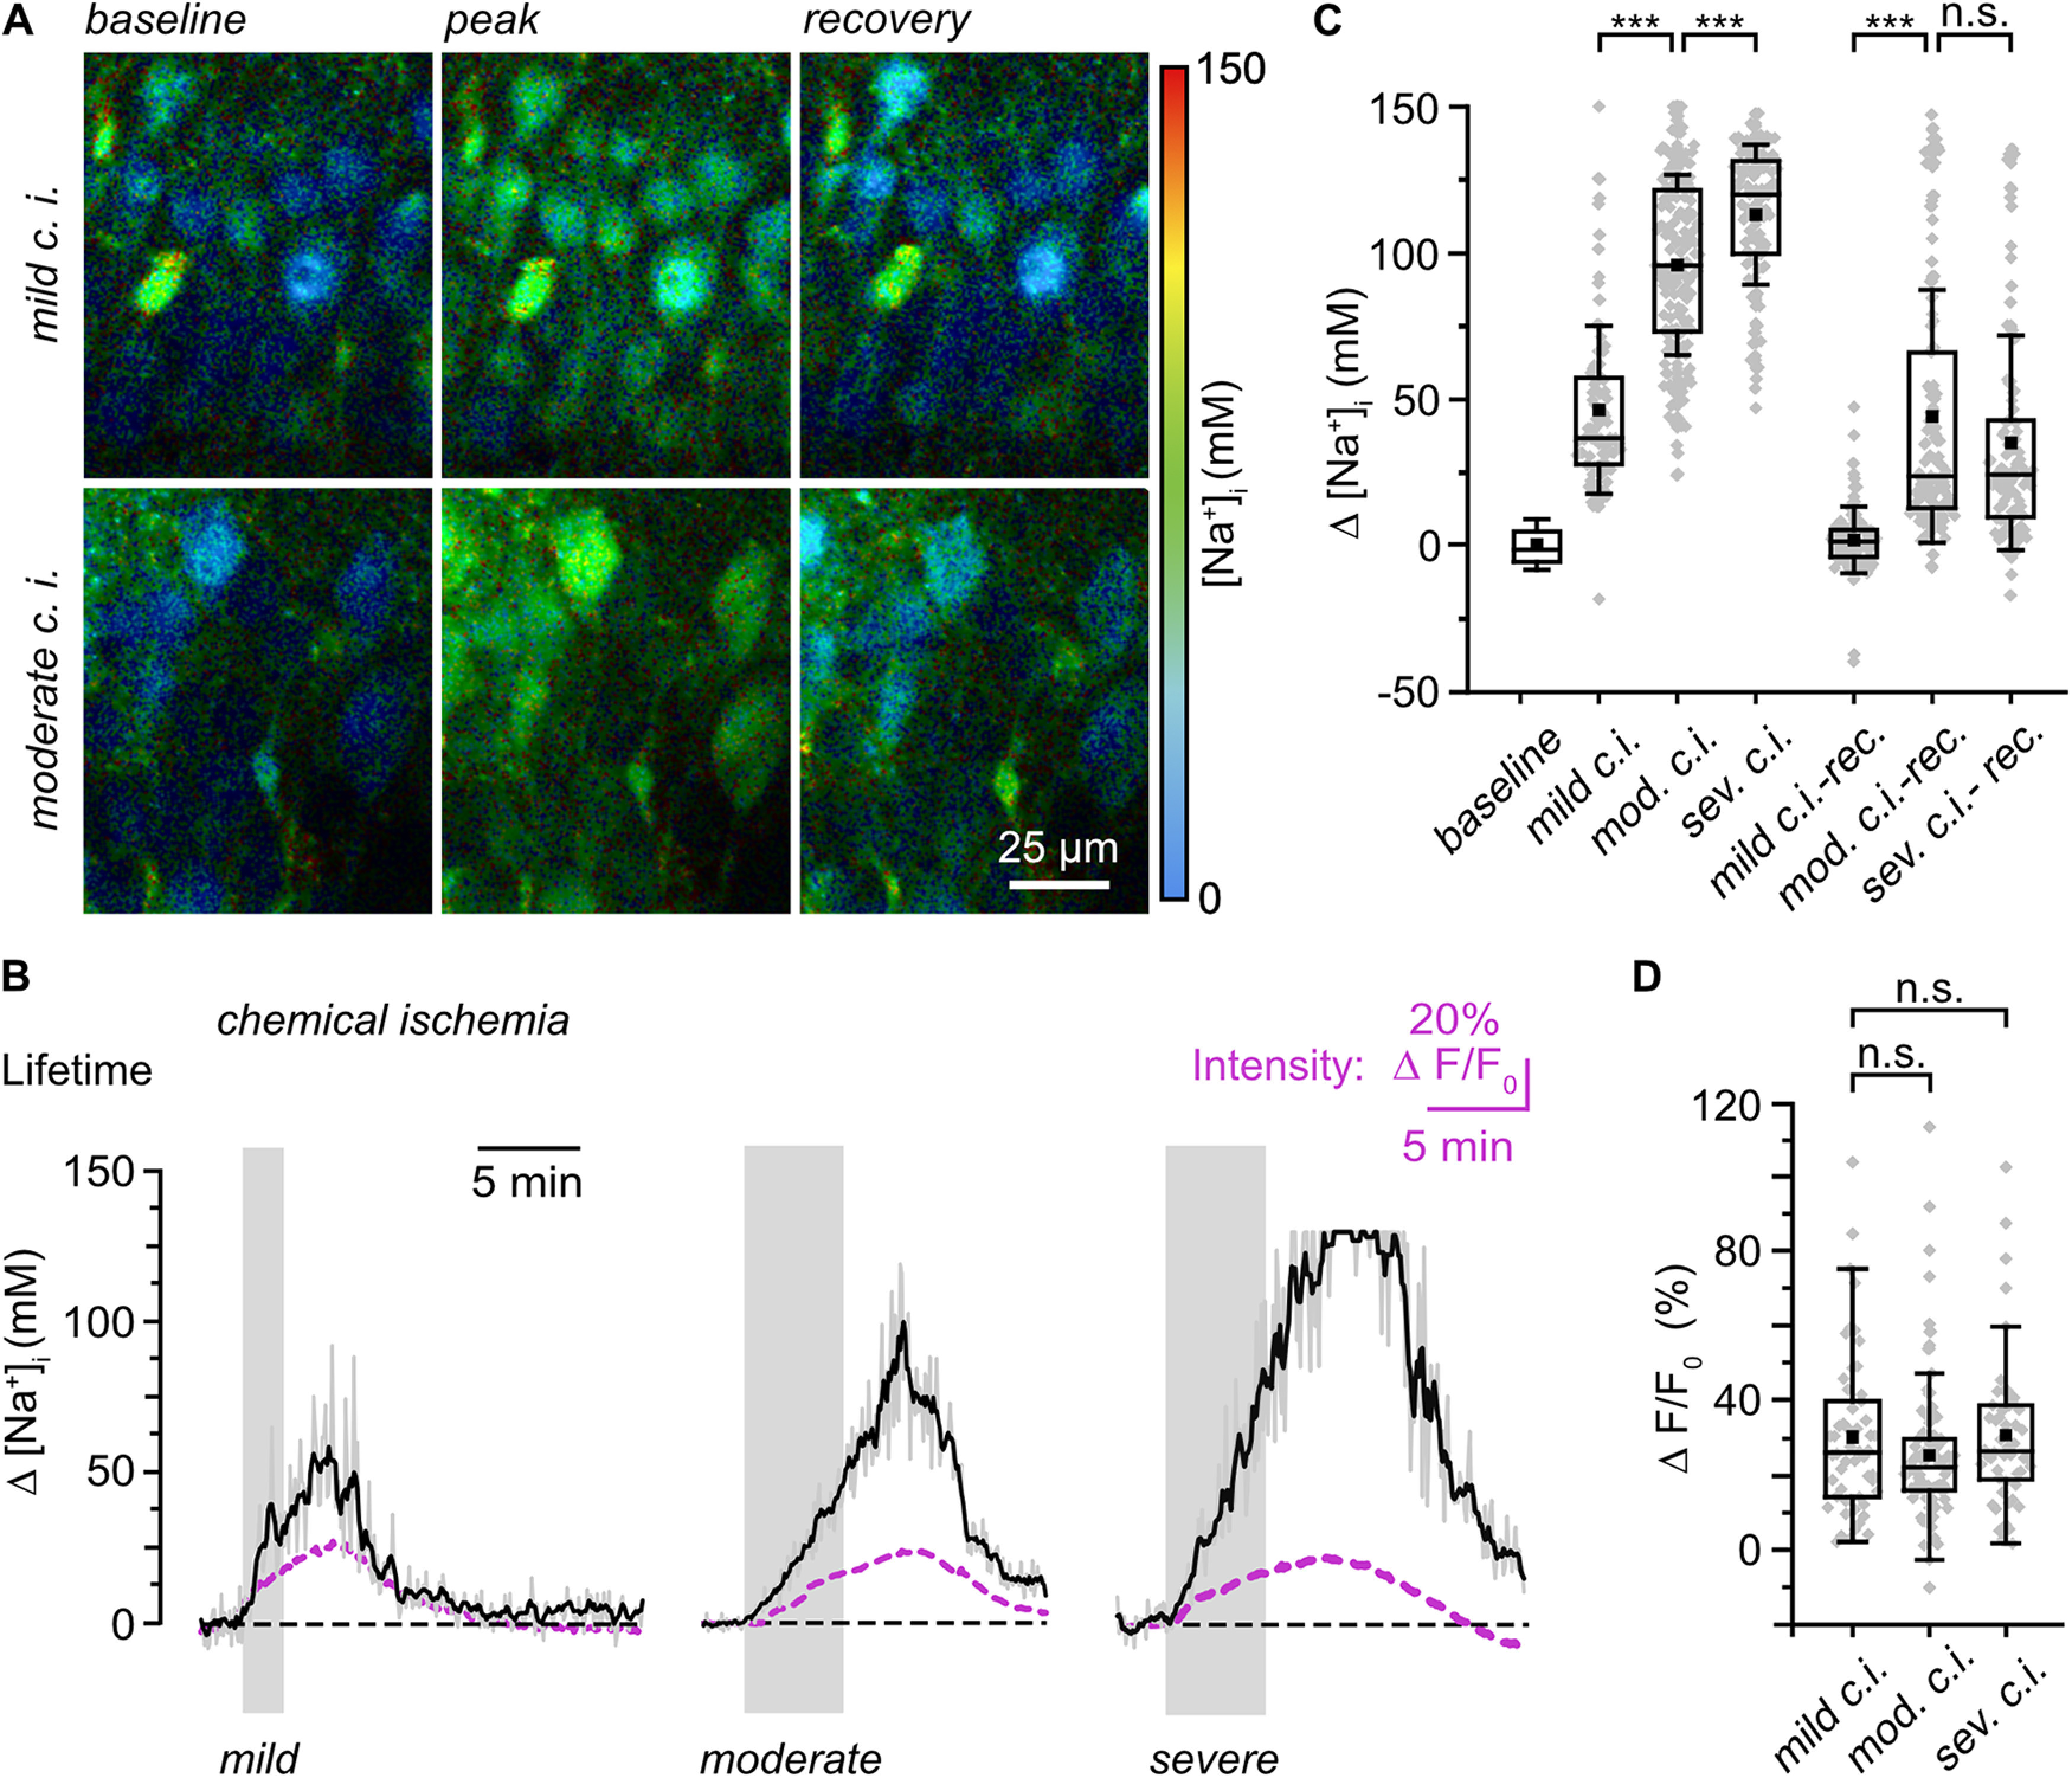
Effects of chemical ischemia on [Na+]i. A, Color-coded FL images, depicted with a 30 s temporal binning, of the CA1 layer of an ING2-loaded acute tissue slice. Right, Color code. Top, Image of [Na+]i at baseline conditions (left); change in [Na+] on mild chemical ischemia taken ∼5 min after starting perfusion with the metabolic inhibitors (middle); recovery taken ∼20 min after starting perfusion with inhibitors (right). Bottom, Same illustration showing the effect of moderate chemical ischemia at ∼7 min and 16 min, respectively in another experiment. B, Changes in [Na+]i reported by rapidFLIM in three different experiments on mild (left), moderate (middle), and severe (right) chemical ischemia as indicated by the gray boxes. Gray traces, individual cell bodies; black traces, averages of all neurons analyzed in one particular experiment (n = 35, 40, and 21, respectively). Note that data points were constrained to the minimum/maximum value of the calibration (0 and 150 mm Na+). Purple traces, averaged changes in fluorescence intensity taken from the same ROIs as for determination of the FL. C, Box plot illustrating changes in [Na+]i in response to mild (n = 158, N = 5), moderate (n = 169, N = 5), or severe (n = 104, N = 5) chemical ischemia and their recovery as determined 5–7 min after the metabolic inhibition. D, Box plot illustrating normalized changes in fluorescence intensity (ΔF/F0) taken at the peak of the [Na+]i changes as reported by rapidFLIM (B) in response to mild (n = 54, N = 5), moderate (n = 96, N = 5), or severe (n = 52, N = 5) chemical ischemia. C, D, Means (square), median (line), 25/75 percentiles (box), SD (whiskers), and single data points (gray diamonds). Mann–Whitney or one-way ANOVA with Tukey's post hoc tests were used for comparison; ***p < 0.001.
