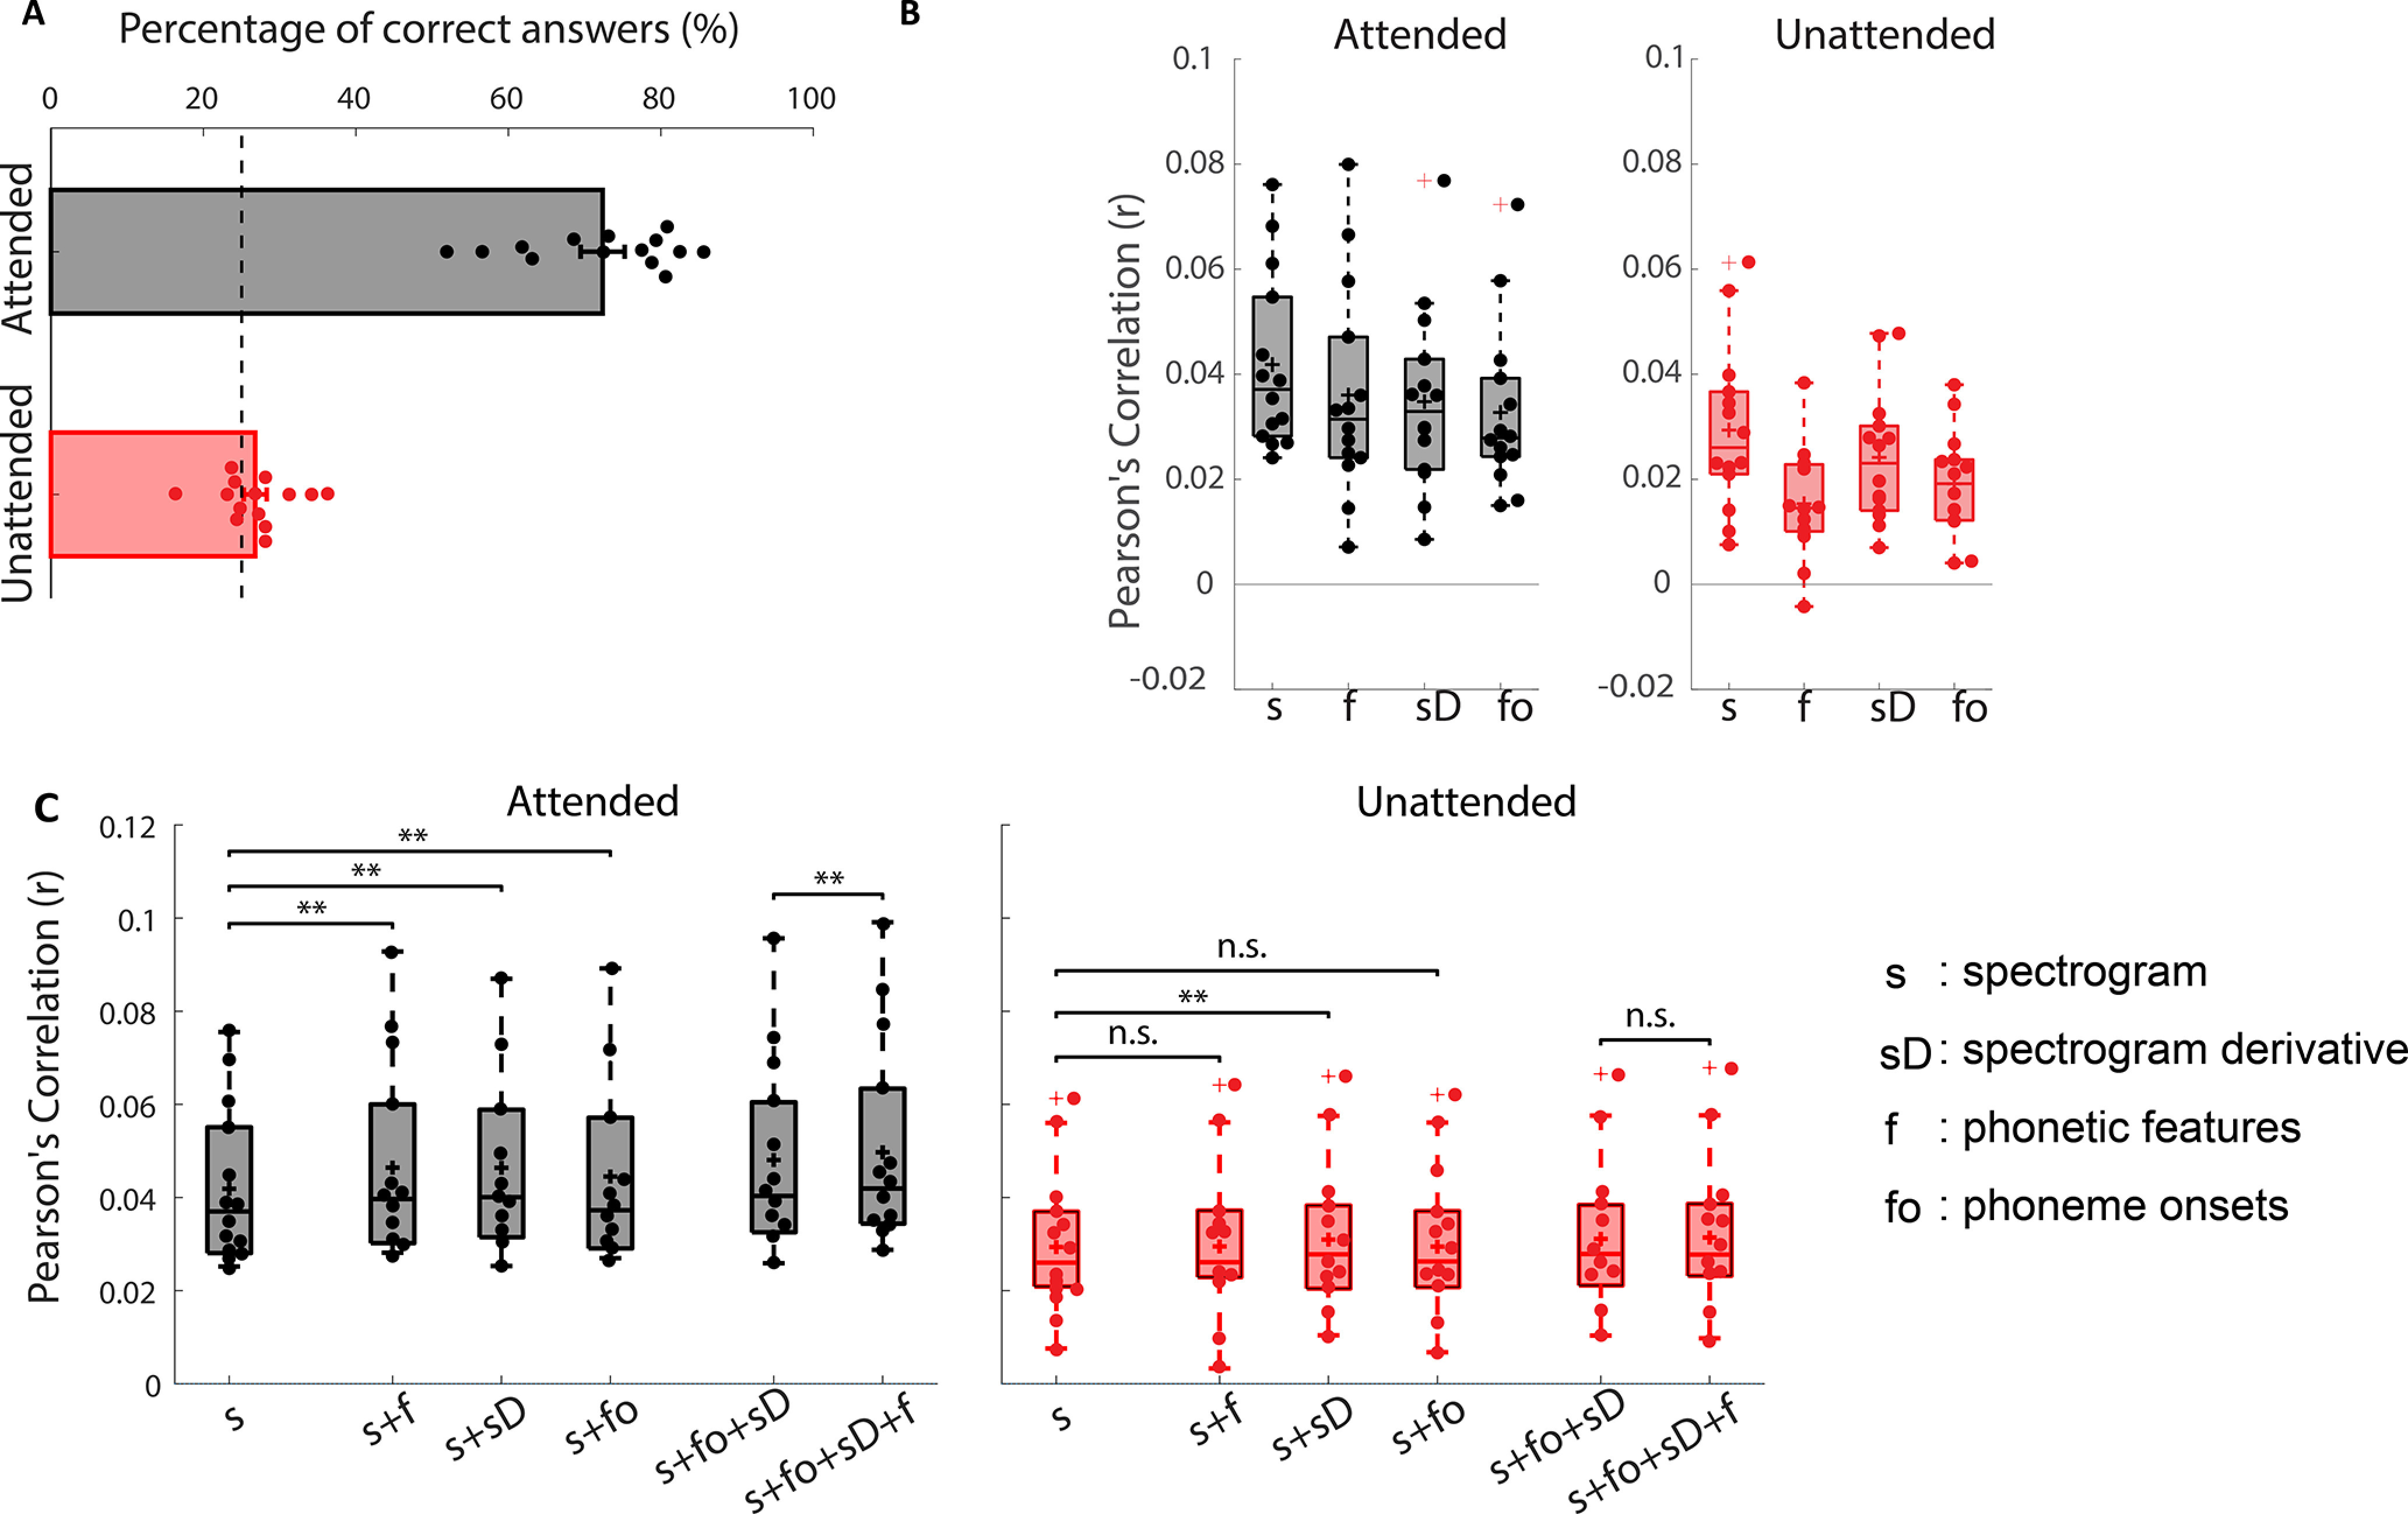
Figure 2.

A, Behavioral (comprehension questionnaire) results; dots indicate individual subject performance. Theoretical chance level is 25% (multiple-choice test with four options) and is indicated by the dashed line. B, Prediction accuracies of individual acoustic and phonetic feature spaces (as labeled on horizontal axes) for the attended and unattended stimuli. There is redundancy between these features, so joint modeling was performed to gauge in particular whether phonetic features add unique predictive power beyond other features. C, Prediction accuracies of joint feature spaces for attended and unattended stimuli (**p < 0.01, two-tailed Wilcoxon sign-ranked test, FDR corrected). On each box, the central horizontal line indicates the median. The bottom and top edges of the boxes indicate the 25th and 75th percentiles of the data, respectively. The whiskers indicate variability outside the upper and lower quartiles. The '+' sign inside the boxes indicates mean value and the '+' sign outside the boxes indicate outlier. n.s. means not significant (p > 0.05).
