. 2021 Nov 9;302(2):410–418. doi: 10.1148/radiol.2021210826

Figure 3:

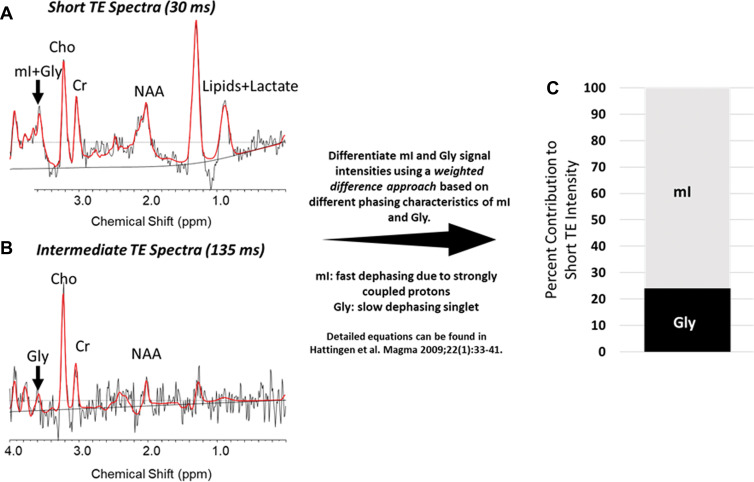
Differentiating between glycine (Gly) and myo-inositol (mI) signal intensities at short echo time (TE). (A, B) For a sample intratumoral voxel, we used multiecho MR spectroscopic imaging data and performed a weighted calculation to distinguish between mI and Gly contributions to short TE signal intensities. Graphs show these results, with peaks indicated for mI plus Gly (or Gly alone), choline (Cho), creatine (Cr), N-acetylaspartate (NAA), and lipids plus lactate (in A only). The real part of the frequency-domain data is plotted as a thin curve. The thick red curve is the LCModel fit to this data. Also plotted as a thin curve is the baseline. ppm = parts per million. (C) Bar graph shows the contribution of mI and Gly to the full signal. In this example, the true mI contribution is 76% of the signal.

Differentiating between glycine (Gly) and myo-inositol (mI) signal intensities at short echo time (TE). (A, B) For a sample intratumoral voxel, we used multiecho MR spectroscopic imaging data and performed a weighted calculation to distinguish between mI and Gly contributions to short TE signal intensities. Graphs show these results, with peaks indicated for mI plus Gly (or Gly alone), choline (Cho), creatine (Cr), N-acetylaspartate (NAA), and lipids plus lactate (in A only). The real part of the frequency-domain data is plotted as a thin curve. The thick red curve is the LCModel fit to this data. Also plotted as a thin curve is the baseline. ppm = parts per million. (C) Bar graph shows the contribution of mI and Gly to the full signal. In this example, the true mI contribution is 76% of the signal.