. 2021 Nov 9;302(2):410–418. doi: 10.1148/radiol.2021210826

Figure 4:

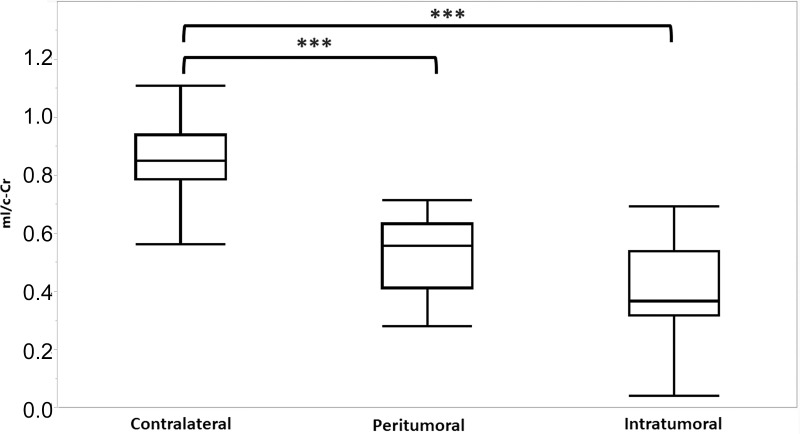
Myo-inositol normalized by contralateral creatine (mI/c-Cr) at baseline in intratumoral, peritumoral, and contralateral volumes of interest. Box plots indicate the 25th and 75th percentiles. The whiskers represent the maximum and minimum values, and the midlines indicate the median (50th percentile). Intratumoral voxels had the lowest median mI/c-Cr, whereas contralateral voxels had the highest mI/c-Cr values. *** = P < .001.

Myo-inositol normalized by contralateral creatine (mI/c-Cr) at baseline in intratumoral, peritumoral, and contralateral volumes of interest. Box plots indicate the 25th and 75th percentiles. The whiskers represent the maximum and minimum values, and the midlines indicate the median (50th percentile). Intratumoral voxels had the lowest median mI/c-Cr, whereas contralateral voxels had the highest mI/c-Cr values. *** = P < .001.