Fig. 3.
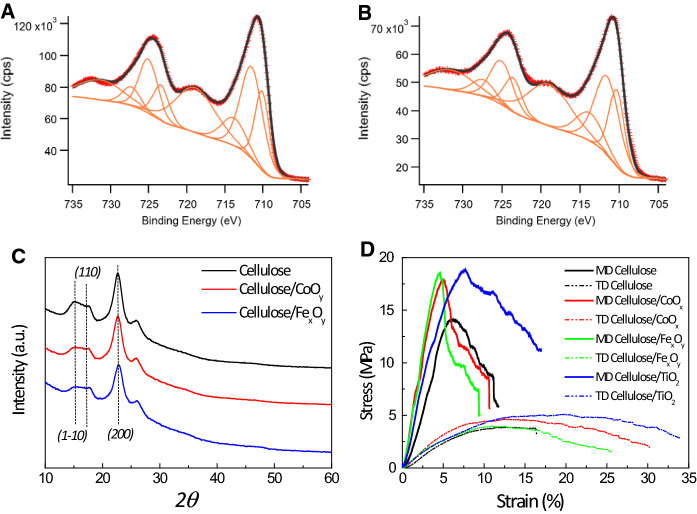
XPS spectra of FexOy corresponding to the Fe 2p region for samples 1 (A) and 2 (B). Markers represent the measured spectrum, orange line the peaks to fit according to ref (Yamashita and Hayes 2008) and black solid line the fitting envelope. The Fe3+/Fe2+ obtained after the fitting corresponds to 2.13 for sample 1, and 1.95 for sample 2. In agreement with a majority of Fe3O4 phase. C) XRD patterns and D) representative tensile stress–strain curves of the samples. MD: machine direction; TD: transverse direction

