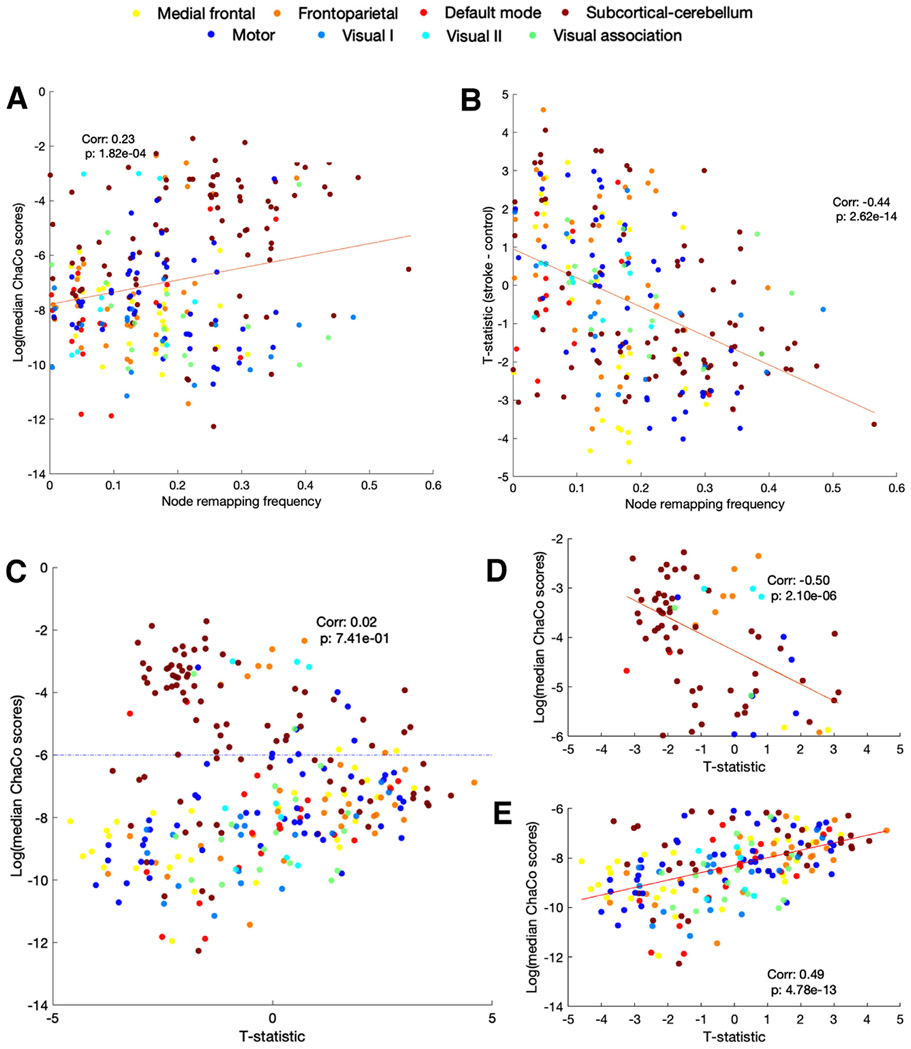
Fig. 4.
Relationships between FC disruption (t-statistic of node strength), SC disruption (ChaCo scores), and remapping over the 1 week - 2 week time interval post-stroke. Nodes are colored by network assignment (legend on top). A. Correlation between node remapping frequency and t-statistic of node strength. A jitter of 0.01 was added to data points along the x-axis to increase visibility. B. Correlation between node remapping frequency and ChaCo scores. A jitter of 0.01 was added to data points along the x-axis to increase visibility. C. Correlation between t-statistic of node strength and ChaCo scores. Dashed horizontal line at y = −6 represents the cut off point of log(ChaCo) −6, representing more SC disruption shown in D, below −6 representing minimal SC disruption is shown in E.

