FIGURE 2.

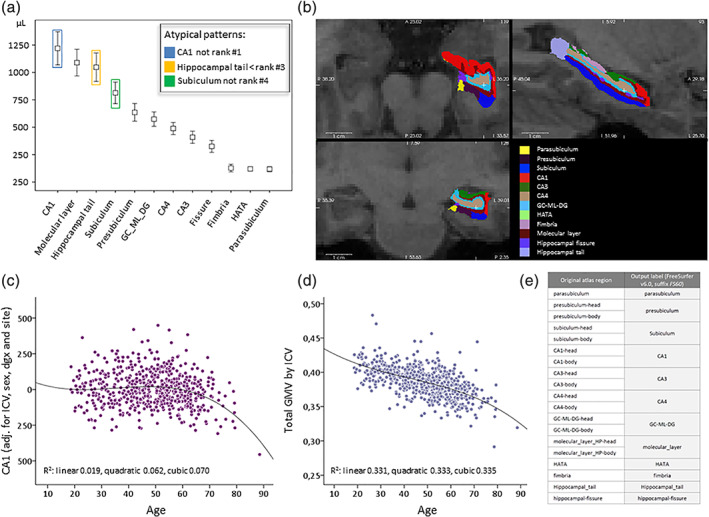
Typical subfield size ranking, overlay in FreeSurfer viewer and exemplary age‐volume relationships. (a) Typically raw subfield volumes ranked according to their average size are depicted from a local Max Planck Institute of Psychiatry (MPIP)‐based sample of N = 614 subjects (T1WI, FS6.0, mean values and 1 SD). The volume ranking order is extremely robust across other samples including 3 Tesla samples (data not shown). The colored frames point to subregions that underlie ranking violation rules (see Section 2.3 for details). (b) A 3 Tesla example viewed in FS in three corresponding planes (see white cross‐hair) with the FS inherent color scheme. The same scheme for the 12 subregions was adopted in the ENIGMA quality control (QC) algorithm. (c) An example of a tendency for nonlinear age effects for the bilateral CA1 region, adjusted for intracranial volume (ICV), sex, diagnosis (major depressive disorder [MDD]/healthy) and site (here coding for coil upgrade related raw image differences). Quadratic or cubic polynomial fits are superior to a linear correlation. (d) The same principle is plotted for the ratio between total gray matter volume and ICV; a less strong nonlinear influence can be read from the fit values. (e) One of three aggregation schemes available in recent development versions of FS, referred to as “FS60,” explaining the mapping between the 12 output labels (which are the labels in the FS6.0 atlas used in this study) and the underlying regions
