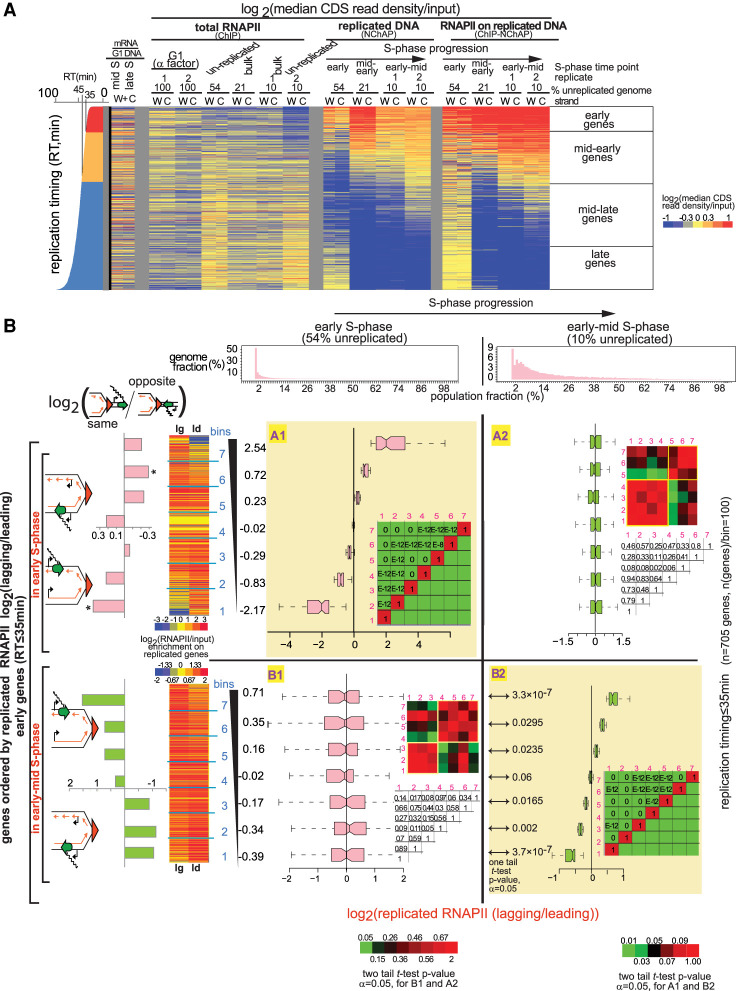
Figure 2.
RNAPII is distributed asymmetrically on replicated gene copies. (A) Heat map of median RNAPII occupancies in coding regions (CDS) of all yeast genes that are not cell cycle-regulated. Reads from promoter regions have been excluded from median read density calculations. Each line is an individual gene and columns represent occupancy values for (W)atson and (C)rick gene copies for different G1- and S-phase time points. S-phase time points are defined by the fraction of the genome that has not yet been replicated: (Early S phase) 54% of the genome is unreplicated over the whole cell population; (mid-early S phase) 21% unreplicated; (early-mid S phase; replicates 1 and 2) 10% unreplicated. The represented fractions are bulk RNAPII (ChIP), replicated DNA (NChAP), and RNAPII on replicated DNA (ChIP-NChAP). The first two columns on the left represent mRNA enrichment over G1 genomic DNA in mid and late S (in the absence of EdU) (Vasseur et al. 2016). Genes are ordered by replication timing of the Watson strand, shown in the bar graph on the left (RT) (Vasseur et al. 2016). (B) Box plot distributions of lagging/leading RNAPII ratios. The figure is organized into a grid. Rows A and B represent the data sets whose lagging/leading ratios were used to sort early genes: (row A) early genes in early S phase; (row B) early genes in early-mid S phase. Columns 1 and 2 represent S-phase time points: (1) early; (2) early-mid S phase. The header row shows the distribution of replicated genome fractions as described in the “Data Analysis” section of Supplemental Material. The 54% unreplicated and the 10% unreplicated (replicate 1) RNAPII ChIP-NChAP from A are, respectively, used as reference points for early and early-mid S phase throughout the article. Early replicating genes in fields A1 and B2 have been sorted by decreasing lagging/leading RNAPII occupancy in early S phase and early-mid S phase, respectively, and divided into seven bins (y-axis) (yellow background), and box plot distribution of RNAPII lagging/leading ratios (x-axis) have been determined for each bin in each time point. The average lagging/leading ratios for each gene bin are indicated in the y-axis on the left. For example, the bottom group of genes (bin 1) in A1 has, on average, 5.6 times more RNAPII on the leading copy than on the lagging in early S phase. The heat maps on the left show RNAPII enrichment on replicated DNA (ChIP-NChAP fractions) for the lagging (lg) and leading (ld) copies of the genes in the seven bins. The bar graphs on the left show the enrichment of “same” genes for each bin indicated in the y-axis calculated as the ratio of “same” orientation genes versus “opposite” genes for each bin normalized to the same/opposite ratio of all 705 early genes (rows A and B; [*] P-value of hypergeometric test < 0.05). The heat map insets in each field show the P-values of the pairwise two tailed t-test for two independent samples (α = 0.05) for each bin pair. The color bars on the bottom left or bottom right correspond to heat maps for fields B1 and A2 or A1 and B2, respectively. The corresponding P-values are also shown in the tables on the right of the box plot graphs within each field (E–12 = 10−12 and E–8 = 10−8). The P-values of the pairwise one-tailed t-test for two independent samples (α = 0.05) between early and early-mid S phase for each bin in row B are shown in B2 on the left of the box plots.

