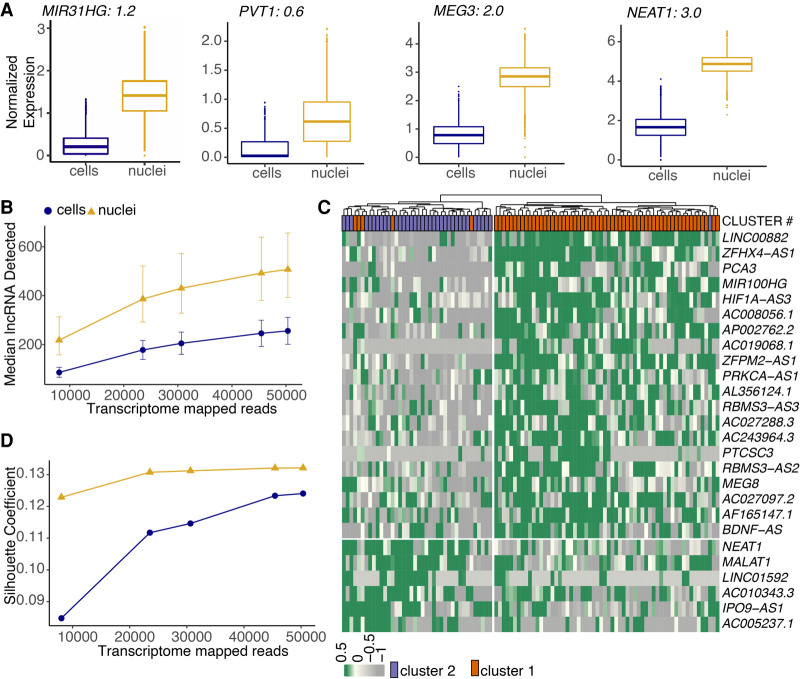
Figure 4.
Nuclear transcriptome is enriched for lncRNAs that regulate adipogenesis and drive cell type differences. (A) Box plots of lncRNAs reported as regulators of adipogenesis. Black text indicates logFC value for white nuclei versus white cell DE test in preadipocytes with a FDR< 0.05 after normalization. (B) Median lncRNAs detected as a function of read depth across single cells and nuclei (both white and brown lineages). Error bars indicate the interquartile range. (C) Hierarchical clustering using scaled expression values of the top-20 up-regulated lncRNAs in brown cluster 1 and cluster 2 in the snRNA-seq data set. One-hundred random barcodes were chosen for this analysis. Top row reflects original cluster assignment for the selected barcodes. (D) Cluster separation resolution quantification between brown cluster 2 versus cluster 1 in the scRNA-seq and snRNA-seq data set. Only lncRNAs were considered for PCA manifold generation. Both data sets were subsampled to have the same number of cells/nuclei and same number of mean transcriptome mapped reads.

