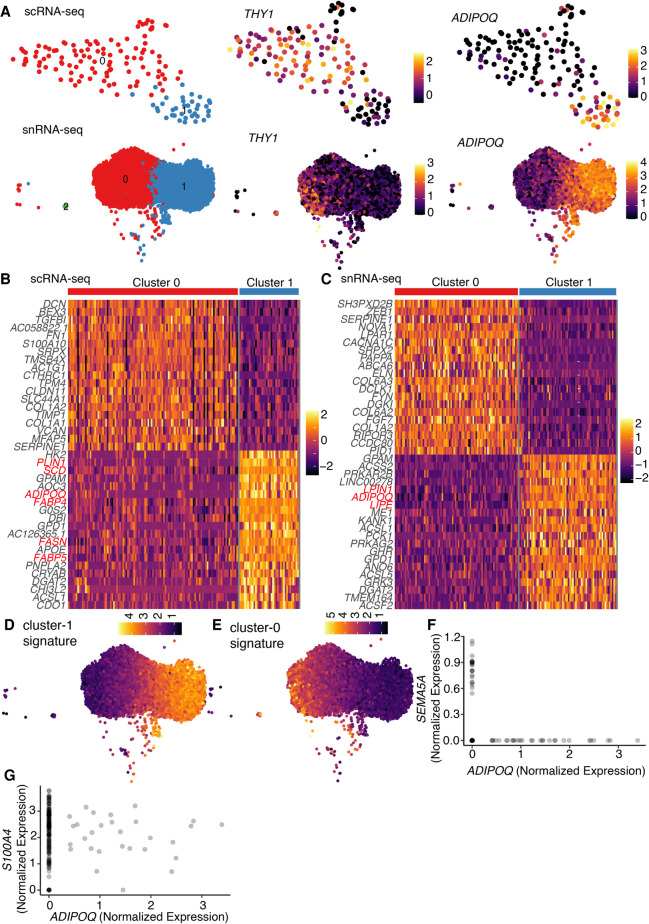
Figure 5.
snRNA-seq detects important transcriptional regulation during adipogenesis in white preadipocytes. (A) UMAP visualization of scRNA-seq and snRNA-seq white adipocyte data sets (day 20) after unsupervised clustering (left panels). The scRNA-seq data set had 109 cells in cluster 0 and 38 cells in cluster 1. The snRNA-seq data set had 4859 nuclei in cluster 0, 4546 nuclei in cluster 1, and 31 nuclei in cluster 2. Expression profile for mesenchymal marker THY1 and mature-adipocyte marker ADIPOQ in both scRNA-seq and snRNA-seq data sets (middle and right panels). (B) Heat map of z-scored expression of the top 20 differentially expressed genes between cluster 0 and cluster 1 in the scRNA-seq white adipocyte data set. Highlighted in red are markers of adipogenesis. (C) Heat map of z-scored expression of the top 20 differentially expressed genes between cluster 0 and cluster 1 in the snRNA-seq white adipocyte data set. A random subset of 150 barcodes was used for this visualization. Highlighted in red are markers of adipogenesis. (D) Heat map of transcriptional signature scores for cluster 1 as plotted on the UMAP visualization of snRNA-seq white adipocyte data. (E) Heat map of transcriptional signature scores for cluster 0 as plotted on the UMAP visualization of snRNA-seq white adipocyte data. (F,G) Normalized expression of genes ADIPOQ and SEMA5A (F) and ADIPOQ and S100A4 (G) in differentiating brown preadipocytes (day 20) scRNA-seq data set. Also see Supplemental Figure S2, G–I.

