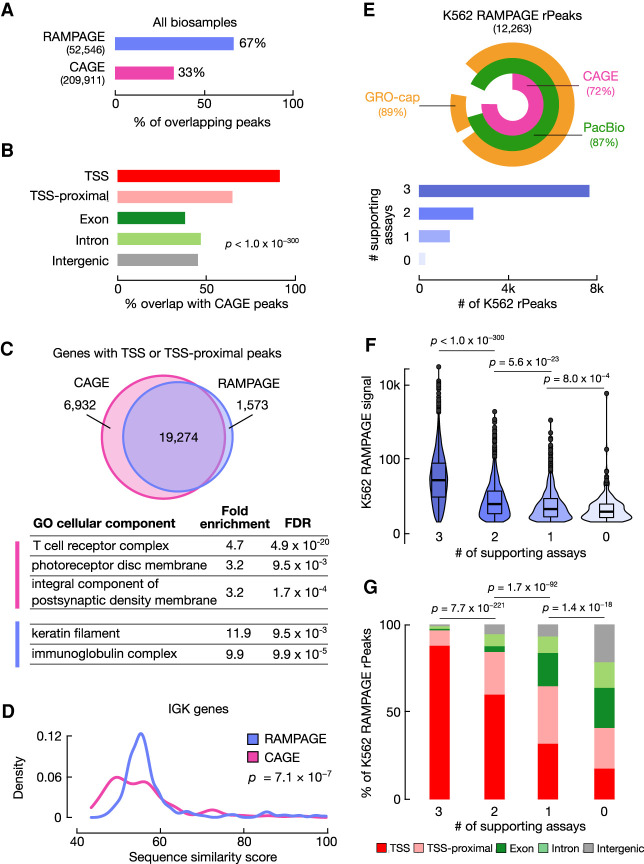
Figure 2.
RAMPAGE rPeaks are concordant with other transcriptome annotations. (A) Bar graph showing the percentage of RAMPAGE rPeaks that overlap CAGE peaks (purple) and the percentage of CAGE peaks that overlap RAMPAGE rPeaks (pink). (B) Bar graph showing the percentages of CAGE-overlapping RAMPAGE peaks in specific genomic contexts as defined in Figure 1B. (C) Venn diagram depicting the overlap of genes whose TSSs have at least one peak within 500 bp between the sets of CAGE peaks (pink) and RAMPAGE rPeaks (purple). Below are representative Gene Ontology terms (cellular component) enriched in CAGE-only genes (pink) or RAMPAGE-only genes (purple). A full list of enriched terms can be found in Supplemental Table S2. (D) Density plot showing the distributions of the similarity scores for sequences surrounding the TSSs of immunoglobulin kappa (IGK) genes supported by only RAMPAGE peaks (purple) or only CAGE peaks (pink). Sequence similarity was calculated as the maximal score of all pairwise local alignments. P-value corresponds to a two-sided Wilcoxon test. (E, top) VennPie diagram with concentric circles displaying K562 RAMPAGE rPeaks that overlap K562 CAGE peaks (pink) or PacBio 5′ ends (green) or have high GRO-seq signals (orange). The overall percentages are shown in parentheses. (Bottom) Bar plot with the number of K562 rPeaks stratified by the number of supporting transcriptomic assays in the above VennPie. (F) Violin-boxplot showing the distributions of the K562 RAMPAGE signal of rPeaks stratified by the number of supporting assays as defined in E. P-values correspond to two-sided pairwise Wilcoxon tests with FDR correction. (G) Stacked bar graphs showing the percentage of K562 rPeaks belonging to each genomic context (TSS: red, TSS-proximal: pink, exon: dark green, intron: light green, intergenic: gray) stratified by the number of supporting assays as defined in E. P-values correspond to Chi-square tests.

