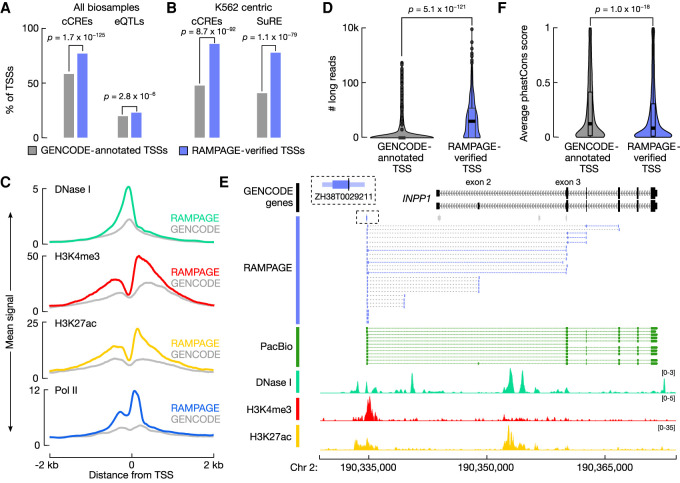
Figure 4.
RAMPAGE-verified rPeaks are enriched for regulatory signatures. (A) Bar plots display the percentage of RAMPAGE-verified TSSs (purple) and matched GENCODE-annotated TSSs (gray) that overlap cell type–agnostic cCREs and the full compendium of GTEx eQTLs. P-values are from Fisher's exact test. (B) Bar plots display the percentage of RAMPAGE-verified TSSs expressed in K562 (purple) and matching GENCODE-annotated TSSs (gray) that overlap K562 cCREs and SuRE assay peaks. P-values are from Fisher's exact test. (C) Aggregation plots of epigenomic signals, DNase I (teal), H3K4me3 (red), H3K27ac (yellow), and Pol II (blue), at K562 RAMPAGE-verified TSSs (colors) and matched GENCODE-annotated TSSs across a ±2-kb window centered on the summits and TSSs, respectively. (D) Nested violin boxplots showing the number of PacBio 5′ read ends that overlap K562 RAMPAGE-verified TSSs (purple) and matched GENCODE-annotated TSSs (gray). P-value is from a Wilcoxon rank-sum test. (E) Genome browser view of INPP1 locus in K562. RAMPAGE-verified TSS, ZH38T0029211, is linked to the INPP1 gene by paired-end RAMPAGE reads (purple), whereas the GENCODE-annotated TSSs are not supported by RAMPAGE reads. PacBio reads (green) also support ZH38T0029211 as a verified TSS of INPP1 and epigenomic signals, DNase I (teal), H3K4me3 (red), and H3K27ac (yellow), support promoter activity at ZH38T0029211 and not at the annotated GENCODE TSSs. RAMPAGE rPeaks with RPM > 2 in K562 are shown in purple, and those with RPM ≤ 2 are shown in gray. (F) Nested violin boxplots of average phastCons conservation scores across RAMPAGE-verified TSSs (purple) and matched GENCODE-annotated TSSs (gray). P-value is from a Wilcoxon rank-sum test.

