Figure 5.
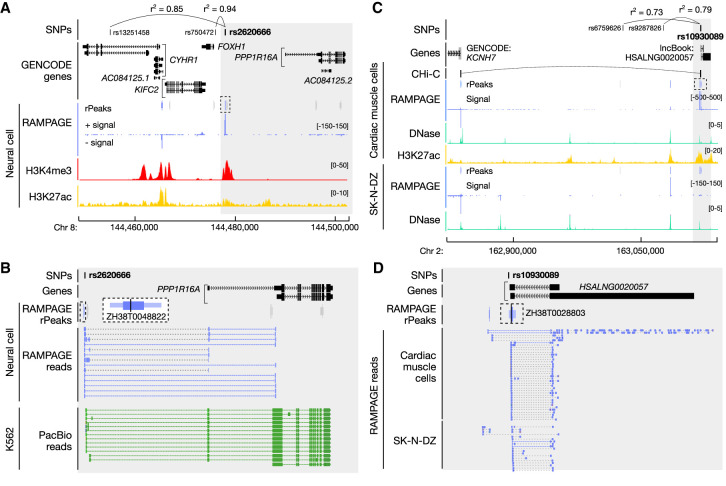
Disease-associated SNPs are linked with new candidate genes using the RAMPAGE rPeak catalog. (A) Genome browser view of the CYHR1–PPP1R16A locus. Rs2620666 is in high LD (shown as r2 values) with GWAS SNPs rs13251458 and rs750472, and overlaps RAMPAGE rPeak ZH38T0048822 (dashed box). RAMPAGE rPeaks with RPM > 2 in neural cells are shown in purple, and those with RPM ≤ 2 are shown in gray; RAMPAGE signal is shown in purple. Supporting epigenomic signals from neural cells, H3K4me and H3K27ac, are shown in red and yellow, respectively. The region shaded in gray is magnified in B. (B) Zoomed-in genome browser view (gray highlight in A) displaying RAMPAGE reads (purple) and PacBio reads (green) supporting RAMPAGE peak ZH38T0048822 (dashed box), which is a verified unannotated TSS of PPP1R16A and overlaps GWAS SNP rs2620666. RAMPAGE peaks are colored as in A, and a magnified image of ZH38T0048822 is shown in a larger dashed box with white background. (C) Genome browser view of the KCNH7 locus. Rs10930089 is in high LD with GWAS SNPs rs6759626 and rs9287826 and overlaps RAMPAGE rPeak ZH38T0028803 (dashed box). RAMPAGE peaks are colored as described in A for cardiac muscle and SK-N-DZ cells. Supporting epigenomic signals from cardiac muscle cells and SK-N-DZ are shown with DNase I in teal and H3K27ac in yellow. CHi-C links for cardiac cells are shown in black. The region shaded in gray is magnified in D. (D) Zoomed-in genome browser view (gray highlight in C) displaying RAMPAGE reads (purple) from cardiac muscle and SK-N-DZ cells supporting RAMPAGE peak ZH38T0028803 (in dashed box), which overlaps two transcripts of the lncBook lncRNA HSALNG0020057 and GWAS SNP rs10930089. RAMPAGE peaks shown in purple have RPM > 2 in both cardiac muscle and SK-N-DZ cells.

