Figure 1.
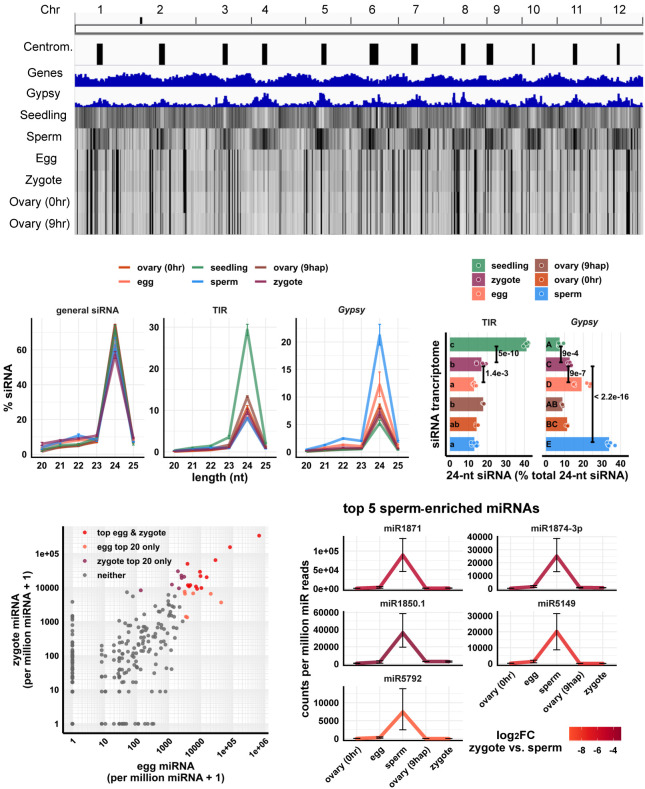
Genome-wide distribution of zygote small RNAs and comparisons of zygote, egg, and sperm small RNAs. (A) Heat map showing abundance of 24-nt siRNA across genome at 50-kb resolution. The first three tracks are centromeres (as defined by Mizuno et al. 2018), genes, and Gypsy retrotransposons. (B) Length profiles of siRNAs. y-axis values are relative to total siRNA reads (20- to 25-nt siRNAs). (TIR) Terminal inverted repeat transposons, CACTA element excluded; (Gypsy) Gypsy retrotransposons. Error bars are 95% confidence intervals for each cell type. miRNA and phasiRNA are not included in this analysis (Supplemental Fig. S1A). (C) Quantification of TIR and Gypsy panels in B. Each data point is an siRNA transcriptome. Bar heights are averages. x-axis values are relative to total 24-nt siRNAs. Letter grouping (α = 0.05) and P-values are based on Tukey tests. (D) Scatter plot showing miRNA relative abundances in egg and zygote. Each data point is a miRNA. Axes are relative to per million miRNA reads and log10 transformed. “top egg & zygote” refers to intersection of the 20 highest abundant miRNAs in both egg and zygote. (E) Top five sperm-enriched miRNAs. Sperm-enriched is classified as >1000 reads per million miRNA reads in sperm and <500 reads per million miRNA reads in egg. y-axis values are relative to per million miRNA reads. Color code reflects log2FC values for zygote versus sperm, and negative values indicate higher in sperm. Error bars are 95% confidence intervals for each cell type. See Supplemental Figure S1D for additional examples. Zygote and 9-hap ovary data are from this study; all other data from Li et al. (2020).

