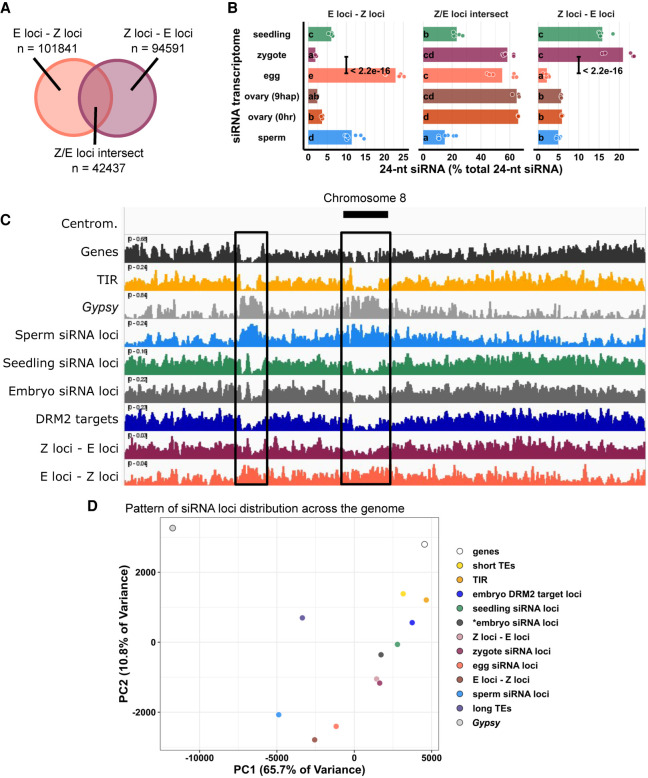
Figure 4.
Widespread distribution of newly detected zygote siRNA loci across the rice genome. (A) Venn diagram illustrating E-Z loci (egg siRNA loci that do not overlap any zygote siRNA loci, E loci ∉ Z loci), Z-E loci (zygote siRNA loci that do not overlap any egg siRNA loci, Z loci ∉ E loci), and Z/E loci intersect (zygote siRNA loci that overlap egg siRNA loci, Z loci ∩ E loci). Sizes of overlap in Venn diagrams are not to scale. (B) Quantification of 24-nt siRNA relative abundances for A. Each data point is an siRNA transcriptome. Bar heights are averages. x-axis values are relative to total 24-nt siRNA reads. Letter grouping (α = 0.05) and P-values are based on Tukey tests. (C) Distribution of siRNA loci along a chromosome. Chromosome 8 is chosen because it is one of the chromosomes with a completed sequenced centromeric region (Mizuno et al. 2018). (Centrom) Centromeric regions, black boxes highlight regions with abundant Gypsy elements and relative depletion of genes, (TIR) seedling siRNA loci, embryo siRNA loci, DRM2 targets, and Z-E loci. (D) Principal component plot showing siRNA loci distribution across the genome. Distributions are evaluated at 50-kb resolution across the genome. Each data point is the distribution of a loci category. Short TEs are TE of lengths between 50 bp and 250 bp. Long TEs are TEs of length >250 bp. Zygote and 9-hap ovary data are from this study; all other data from Li et al. (2020).

