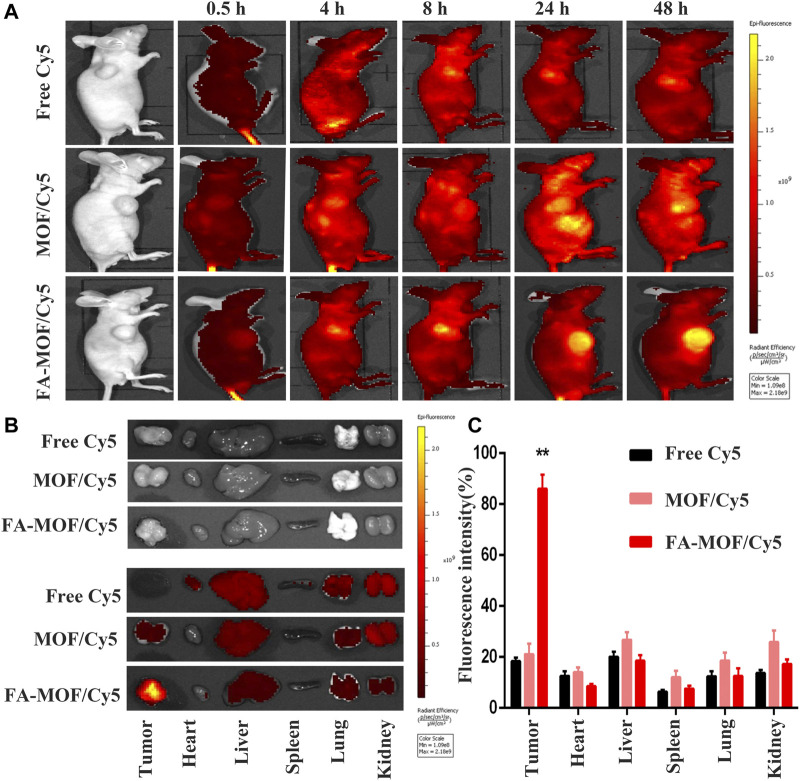
FIGURE 4.
In vivo fluorescence imaging of tumor-bearing mice at 0.5, 4, 8, 24, and 48 h after intravenous injection; the decrease of fluorescent intensities was indicated by the color bar from yellow to red (A). Main organs, including heart, liver, spleen, lungs, and kidneys, and tumors were collected from mice at 48 h post injection for fluorescence images (B). Biodistributions of Cy5, MOF/Cy5, and FA-MOF/Cy5 in tumor issues and different organs. (C) **p < 0.01.

