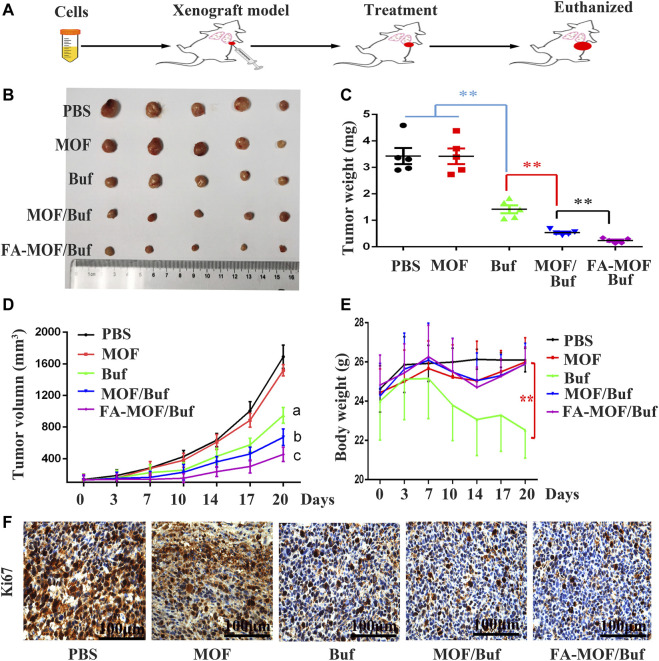
FIGURE 5.
Anticancer efficacy on the subcutaneous tumor mouse model. (A) Flow chart of the experiment. (B) Representative tumor tissues excised from mice at the end of treatment. (C) Tumor weight at the end of treatment. (D) Body weight of tumor-bearing mice during the period of treatment. (E) Tumor volume with time after cancer cell inoculation. (F) Expression of Ki67 in cancer tissues, measured by IHC staining (scale bar: 100 μm). Data are expressed as mean ± SD (n = 6), **p < 0.01, a p < 0.01 Buf vs. PBS, b p < 0.05 MOF/Buf vs. Buf, c p < 0.05 FA-MOF/Buf vs. MOF/Buf.

