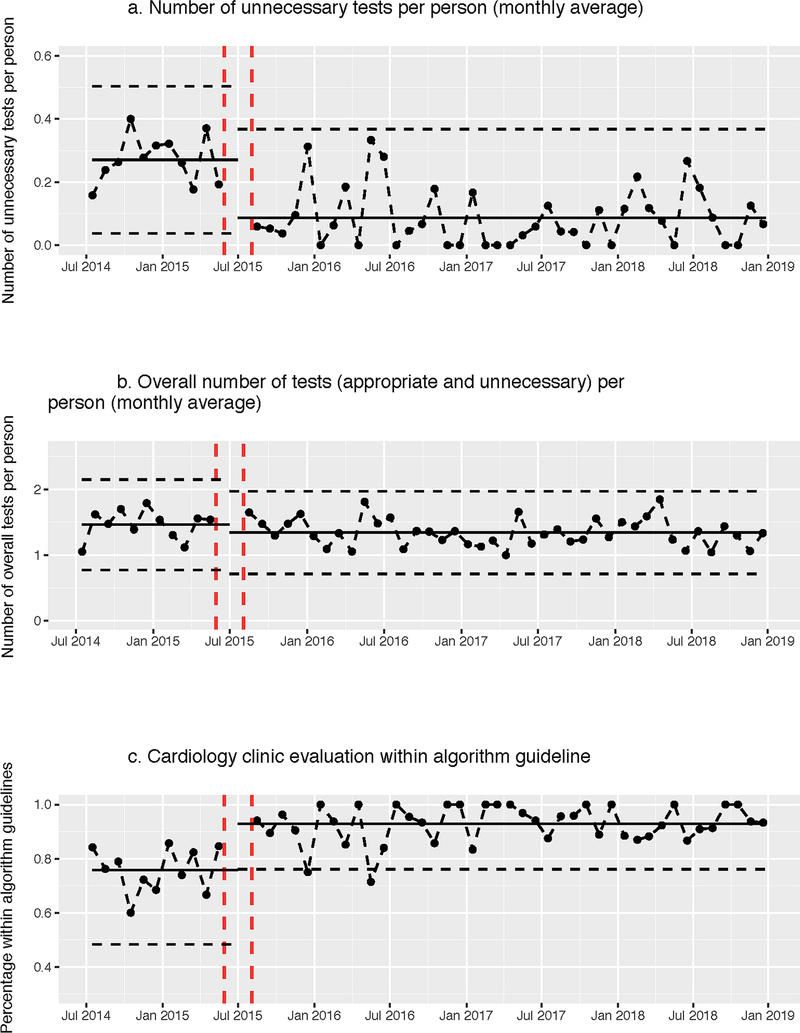
Fig. 3.
Statistical process control charts of cardiac testing outcomes during the study period. First vertical dashed lines represent implementation of guidelines and second vertical dashed lines represent the end of the washout period. Solid horizontal line is the overall mean (central line), estimated as the mean of monthly average (dots). Dashed horizontal lines represents the upper and lower control limits, calculated as overall mean ± 3 standard deviations. This is done separately for the pre- and post-intervention period

