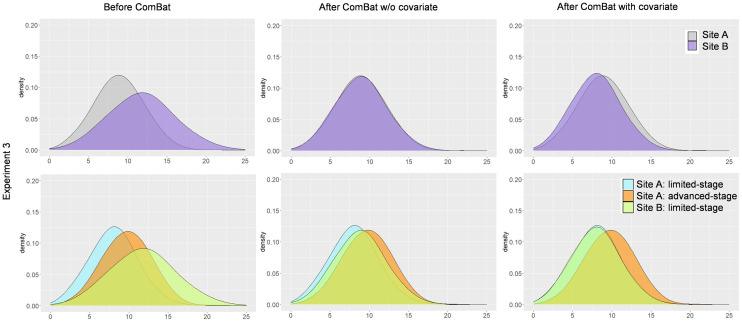
FIGURE 5.
Distributions for experiment 3 (Table 1). (Left) Distributions before ComBat. (Center) Distributions after ComBat (without covariate). (Right) Distributions after ComBat and specifying stage as covariate. (Top) Pooling of data at each site. (Bottom) Data represented per site and stage.

