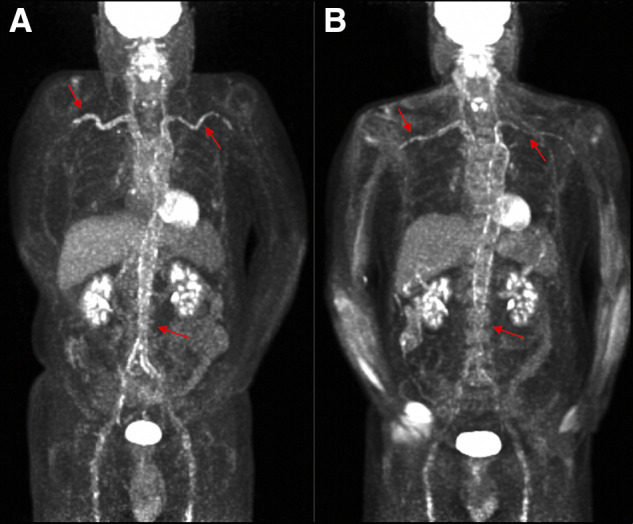
FIGURE 4.

Improvement in 18F-FDG activity over time in patient with severe vascular inflammation. (A) Baseline imaging study with PETVAS of 27 (maximal score). (B) Follow-up imaging 6 mo later with continued PETVAS of 27 despite visual improvement in arterial 18F-FDG uptake and corresponding decrease in semiquantitative metrics (TBRLiver) from 3.90 to 2.73. Arrows show areas of increased 18F-FDG uptake in right and left subclavian/axillary arteries and abdominal aorta.
